
Precision
Precision was assessed with spiked CSS and human plasma
at low and high concentration levels. Inter- (n=15) and
intra-batch (n=5) coefficient of variation (CV) values
ranged between 3.5% and 18.0% (Table 2).
Ionization Suppression
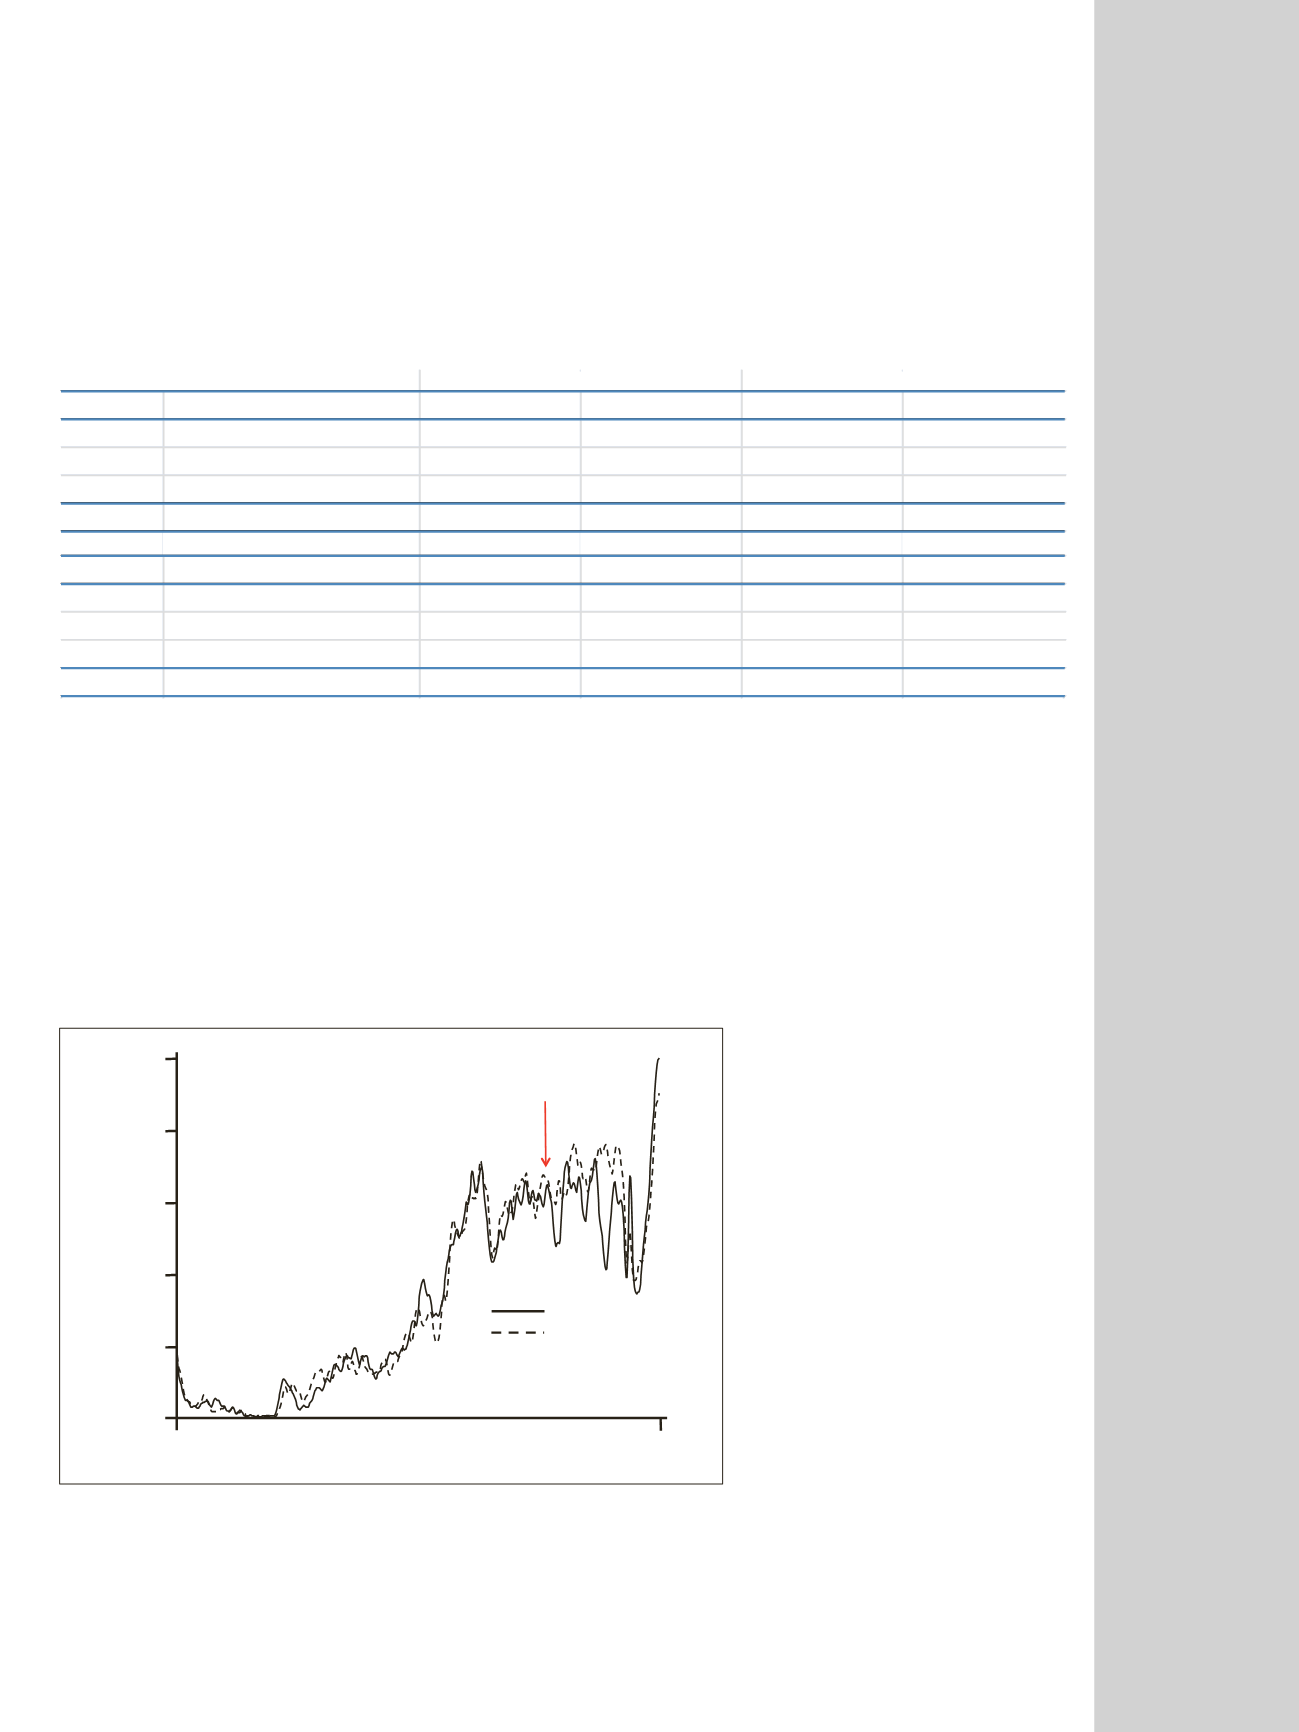
In this test, a constant flow (5 µL/min) of E2-d5
(100 ng/mL) was infused post-column into the mobile
phase using a T-junction while protein-crashed human
plasma (without internal standards) or mobile phase buffer
(blank) were injected. An SRM transition of the infused
E2-d5 was monitored for the entire LC gradient.
Compared to the solvent blank (60% methanol in water),
no obvious ionization suppression was detected in the
SRM chromatogram of infused E2-d5 (Figure 5).
Table 2. Precision data
Figure 5. Ionization suppression test
5
For Clinical Research Use Only. Not for Diagnostic Procedures
Figure 5
4.6
1490
1192
894
596
298
0
Retention Time (min)
Intensity
Blank solvent
Plasma
8.0
Red arrow shows E2 retention time.
Charcoal Stripped Serum Low (15 pg/mL)
High (364 pg/mL)
Low (15 pg/mL)
High (357 pg/mL)
Batch 1
Intra-assay Precision (n=5, %)
9.9
9.6
13.5
11.5
Batch 2
Intra-assay Precision (n=5, %)
17.1
3.5
12.4
4.3
Batch 3
Intra-assay Precision (n=5, %)
14.6
7.2
17.2
4.8
Batch 1-3
Inter-assay Precision (n=15, %)
13.1
8.1
14.0
8.4
Spiked Pooled Plasma
Low (12 pg/mL)
High (239 pg/mL)
Low (11 pg/mL)
High (227 pg/mL)
Batch 1
Intra-assay Precision (n=5, %)
5.3
5.8
18.0
7.9
Batch 2
Intra-assay Precision (n=5, %)
12.9
7.1
16.3
4.3
Batch 3
Intra-assay Precision (n=5, %)
10.0
6.8
12.3
9.0
Batch 1-3
Inter-assay Precision (n=15, %)
9.3
6.3
17.3
7.1
E1
E2


