
Results
Quantitation
Calibration curves were established using neat standards
based on ion intensities from full-scan MS/MS chro-
matograms. Chromatograms for all the compounds listed
in Table 1 were obtained in a single chromatographic run
at each concentration. Figure 2 shows reconstructed ion
chromatograms (RICs) from the analysis of the 50 pg/µL
standards. The MS/MS spectra for all the drugs, with the
exception of ketoprofen, are shown in Figure 3.
The MS/MS spectra were generated using a Normalized
Collision Energy of 28%. The use of Normalized Collision
Energy alleviates the necessity to optimize the collision
energy for each compound as is necessary in traditional
triple-quadrupole analysis, thus making this method
extremely easy to set up and run. Compounds that under-
went a non-specific water loss were additionally frag-
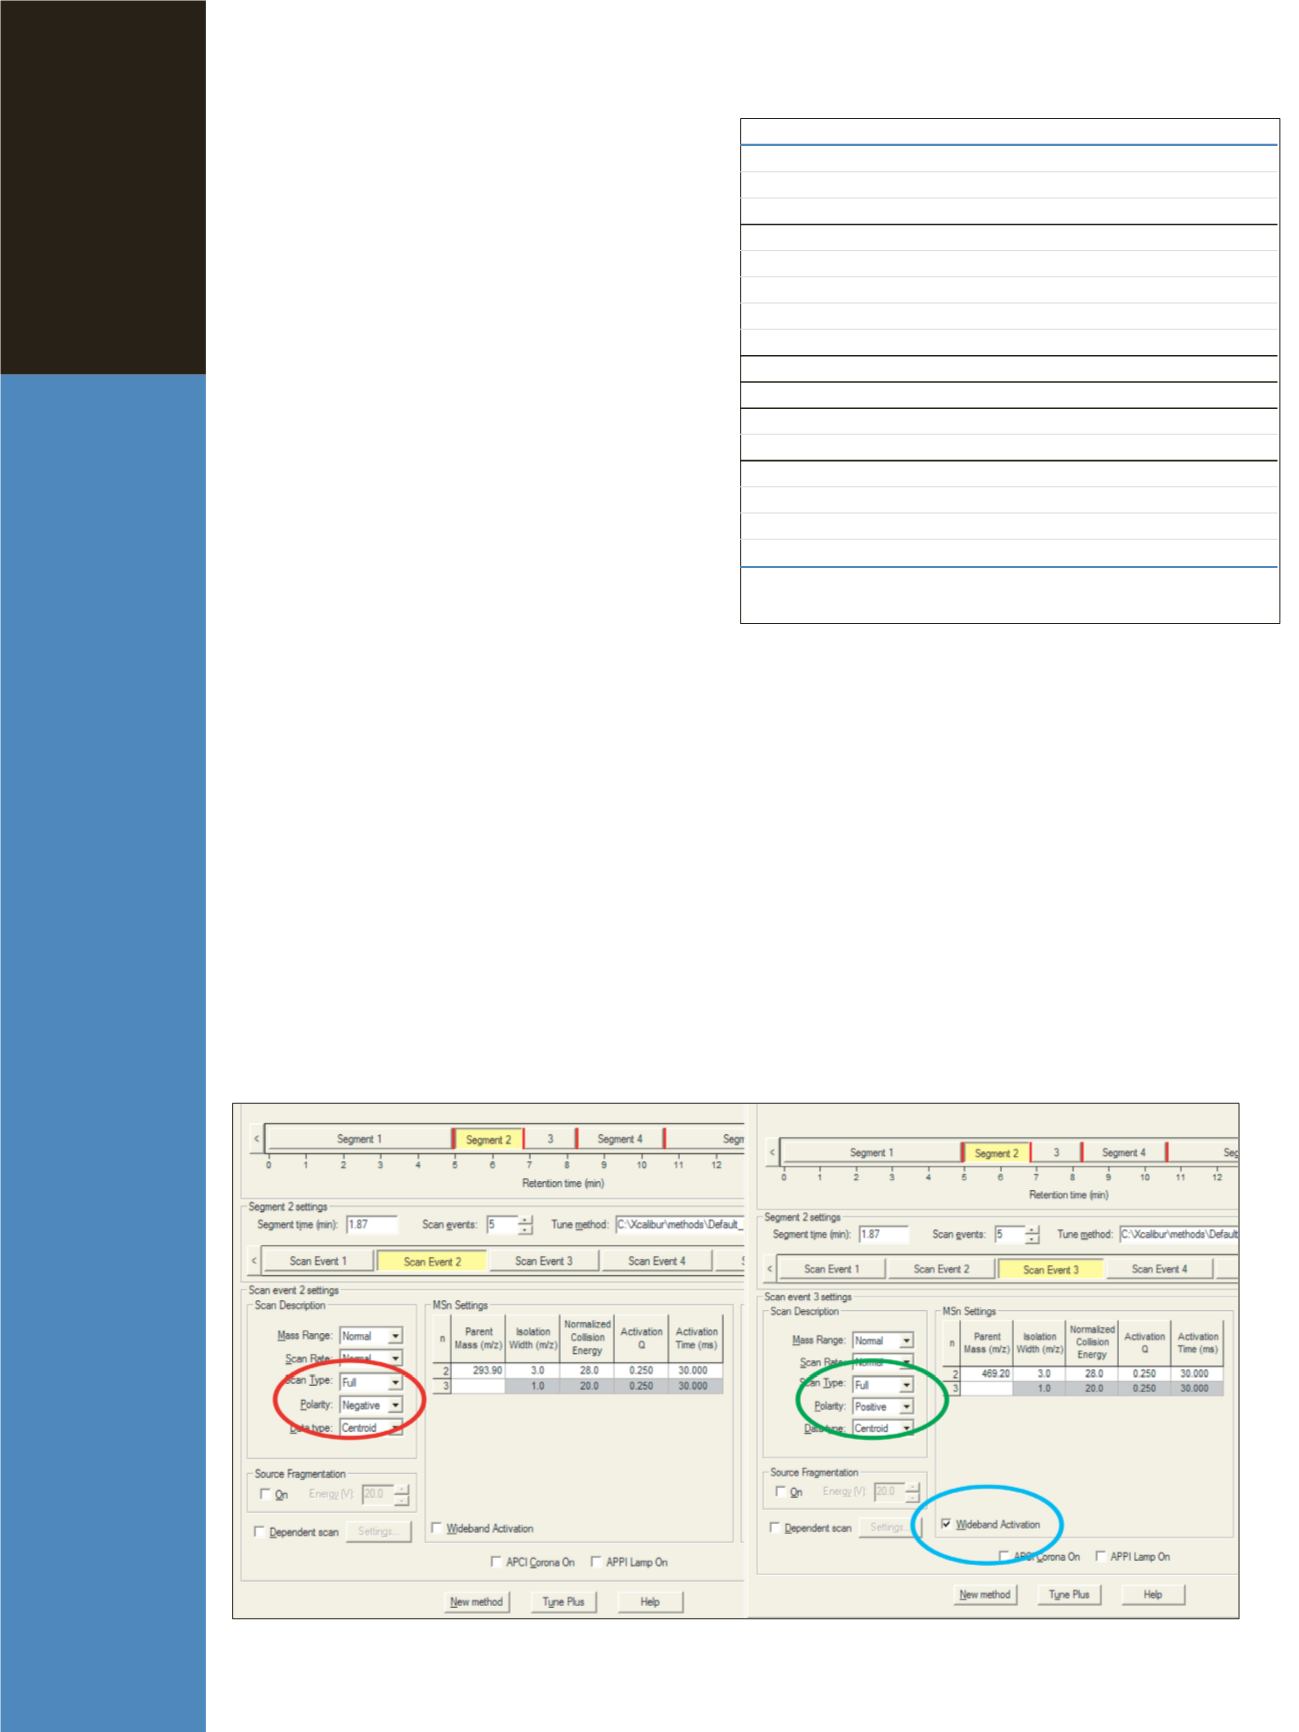
mented using WideBand Activation (see Table 1). This
mode of fragmentation results in information-rich spectra
enabling structural confirmation without requiring an
additional MS
3
transition. The compound ketoprofen
undergoes a neutral loss outside of the WideBand
Activation window and was selected for an MS/MS to
MS
3
comparison study and is discussed later.
Chromatographic and mass spectrometric methods
were validated using the neat standards; subsequently the
experiments were repeated using standards in horse urine.
The RICs from these experiments are shown in Figure 4.
Using the RICs, calibration curves were created for each
of the compounds either neat (Figure 5) or in urine
matrix (Figure 6). The calibration curves were linear over
the three orders of magnitude assayed. In addition to
demonstrating linearity, the quantitative results shown in
Tables 2 and 3 demonstrate excellent reproducibility.
Table 1: List of target compounds; corresponding RT (retention time), segment
(method segment see Figure 1),
m/z
denotes isolation mass and Ion Polarity,
WB–WideBand Activation, RIC–masses used in generation of Reconstructed
Ion Chromatograms for quantitation.
2
Figure 1: Instrument Setup settings for chlorothiazide (segment 2, scan event 2) and cromolyn-Na (segment 2, scan event 3)
SEGMENT RT ID# COMPOUND
M/Z
WB
RIC
1
3.40 416 Theobromine
181.0
137
+
163
+
181
4.44 417 Theophylline
181.0
124
+
137
4.56 152 Dyphylline
255.1
181
2
5.58 071 Caffeine
195.1
138
5.71 089 Chlorothiazide
-293.9
214
+
215
6.02 107 Cromolyn-Na
469.2
!!!
245
6.20 198 Hydroclorothiazide -295.8
205
+
232
+
269
6.49 311 Pemoline
177.0
106
3
7.20 614 Petoxifyline
279.1
181
4
8.95 117 Dexamethasone
393.1
!
355
+
337
+
319
9.60 481 Boldenone
287.1
!
121
+
135
+
173
10.16 499 Ketoprofen
†
255 (209)
209 (105
+
194)
5
11.28 216 Indomethacin
358.0
139
+
174
11.33 130 Diclofenac
295.9
!
215
+
250
11.93 175 Flufenamic Acid
282.1
264
12.05 235 Meclofenamic Acid 295.9
!
242
+
243
†
Ketoprofen was analyzed by both MS/MS and MS
3
for comparison study.
4
WB denotes use of wideband activation during MS/MS fragmentation.


