
The %RSD for three replicate injections is less than 10% for
all neat standards at the 1 pg/µL level and higher (see Table 2).
The results for standards in urine were also excellent.
The %RSD, five replicate injections, for the lowest level
assayed in urine was less than 10% for most analytes (see
Table 3), and commonly less than 3% for mid- and
high-concentration samples. To complete the quantitative
study, two QC urine samples were analyzed. The results
shown in Table 4 demonstrate a high level of quantitation
accuracy, with a deviation of less than 10% for most analytes.
In addition, excellent reproducibility was demonstrated
with the %RSD being less than 8% for all but two
compounds (see Table 4).
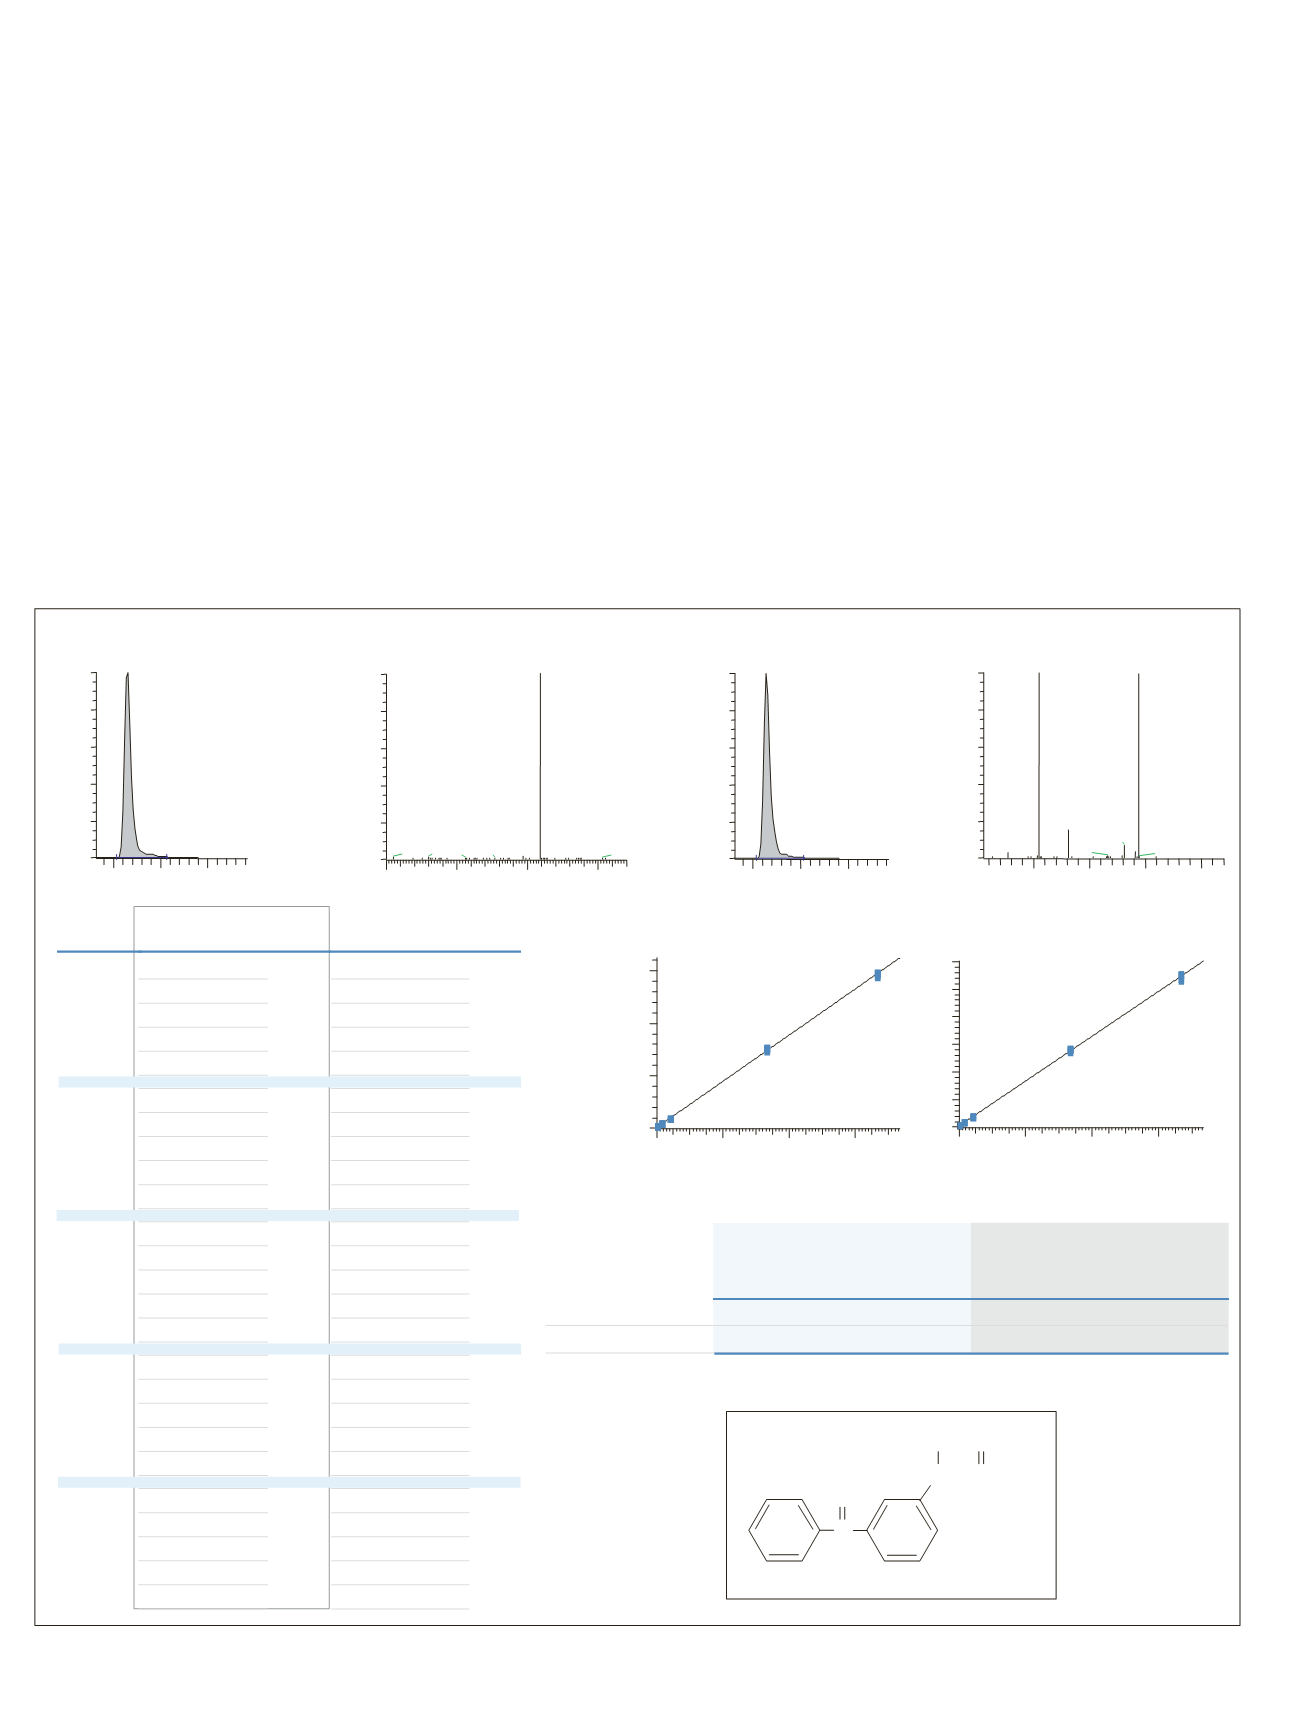
Ketoprofen – MS/MS vs. MS
3
:
Ketoprofen undergoes a neutral
loss of a 46 amu fragment in MS/MS mode due to the loss of
the carboxyl group (see Ketoprofen structure). This is outside
of the mass window for WideBand Activation and thus, an
MS
3
experiment was performed to generate additional
diagnostic ions without sacrificing sensitivity or reproducibil-
ity. To demonstrate this, standards and two urine QC samples
were analyzed in both MS/MS and MS
3
mode, with results
shown in Figure 7. There is no loss of sensitivity, accuracy,
or reproducibility in obtaining this additional information.
The %RSD from the MS/MS and MS
3
data are virtually
identical. While the sensitivity remains unchanged, the
accuracy in the analysis of the unknowns is actually
improved in the MS
3
experiments (see Figure 7).
Robustness
To assess the ruggedness of the method, a 166 pg/µL
standard in horse urine was assayed over 100 consecutive
injections. The results are displayed in Figure 9. The mean
and coefficient of variation (%CV) for four compounds:
theobromine, caffeine, pentoxyphylline, and ketoprofen
were determined to be less than 4% for all four compounds.
5
MS/MS: 255
10.0
10.5
11.0
Time (min)
0
20
40
60
80
100
Relative Abundance
RT: 10.15
SN: 2857
100
150
200
250
m/z
0
20
40
60
80
100
104.94
193.96
130.99
181.03
76.96
166.03
194.65
Area
Ketoprofen
Y = 8058.18+2201.79*X R^2 = 0.9996
0
200
400
600
0
500000
1000000
1500000
Ketoprofen-MS
3
Y = 4911+812.486*X R^2 = 0.9993
0
200
400
600
0
100000
200000
300000
400000
500000
600000
Area
100
150
200
250
m/z
0
20
40
60
80
100
208.97
MS
3
: 255 209
10.0
10.5
11.0
Time (min)
0
20
40
60
80
100
SN: 2166
Unknown 2
Ketoprofen 41.6 38.0 91.4% 1.22% 104.1 104.6 100.5% 1.53%
Ketoprofen - MS
3
41.6 41.7 100.2% 1.26% 104.1 106.1 101.9% 2.05%
Conc. (pg/µL)
Cal. Conc.
Difference
%RSD
Conc. (pg/µL)
Cal. Conc.
Difference
%RSD
Unknown 1
20350
6.073
19635
5.751
20281
6.042
20046
5.936
19185
5.548
45386 17.362
43015 16.293
44934 17.158
42855 16.221
42111 15.885
90353 37.637
87917 36.539
87285 36.254
91348 38.086
87594 36.393
762536 340.72
760825 339.948
755161 337.394
762369 340.644
733111 327.452
1447518 649.573
1482572 665.378
1505908 675.901
1505854 675.876
1466808 658.27
8205
3.874
8012
3.636
8201
3.87
7928
3.531
8137
3.79
17551 15.425
18007 15.988
17120 14.892
17380 15.214
17830 15.769
37454 40.022
36469 38.805
37773 40.417
36210 38.485
37289 39.818
279903 339.663
278910 338.436
270466 328.
282912 343.382
284341 345.147
554232 678.703
519271 635.495
551821 675.723
552697 676.806
533792 653.441
1.72%
1.67%
2.23%
3.86%
3.75%
650 pg/µL
33.3 pg/µL
41.6 pg/µL
16.6 pg/µL
3.3 pg/µL
2.86%
1.97%
2.09%
2.82%
4.05%
AREA CAL. CONC. %RSD
SAMPLE
KETOPROFEN
AREA CAL. CONC. %RSD
KETOPROFEN - MS
3
O
C
CH
3
CH – C – OH
O
Ketoprofen
Figure 7: Comparison of MS/MS to MS
3
quantitation of Ketoprofen


