
3
3
4
5
6
Time (min)
0
50
100
0
50
100
0
50
100
0
50
100
0
50
100
RT: 2.99
RT: 4.25
RT: 4.24
RT: 3.01
RT: 4.36
RT: 5.46
RT: 5.57
6
7
8
9
Time (min)
0
50
100
0
50
100
0
50
100
0
50
100
0
50
100
RT: 5.97
RT: 6.08
RT: 6.45
RT: 7.18
RT: 8.95
10
11
12
Time (min)
0
50
100
0
50
100
0
50
100
0
50
100
0
50
100
0
50
100
RT: 9.60
RT: 10.15
RT: 11.28
RT: 11.34
RT: 11.95
RT: 12.06
Theobromine
Theophylline
Dyphylline
Caffeine
Chlorothiazide
Cromolyn-Na
Hydrochlorothiazide
Pemoline
Pentoxifylline
Dexamethasone
Boldenone
Ketoprofen
Indomethacin
Diclofenac
Flufenamic Acid
Meclofenamic Acid
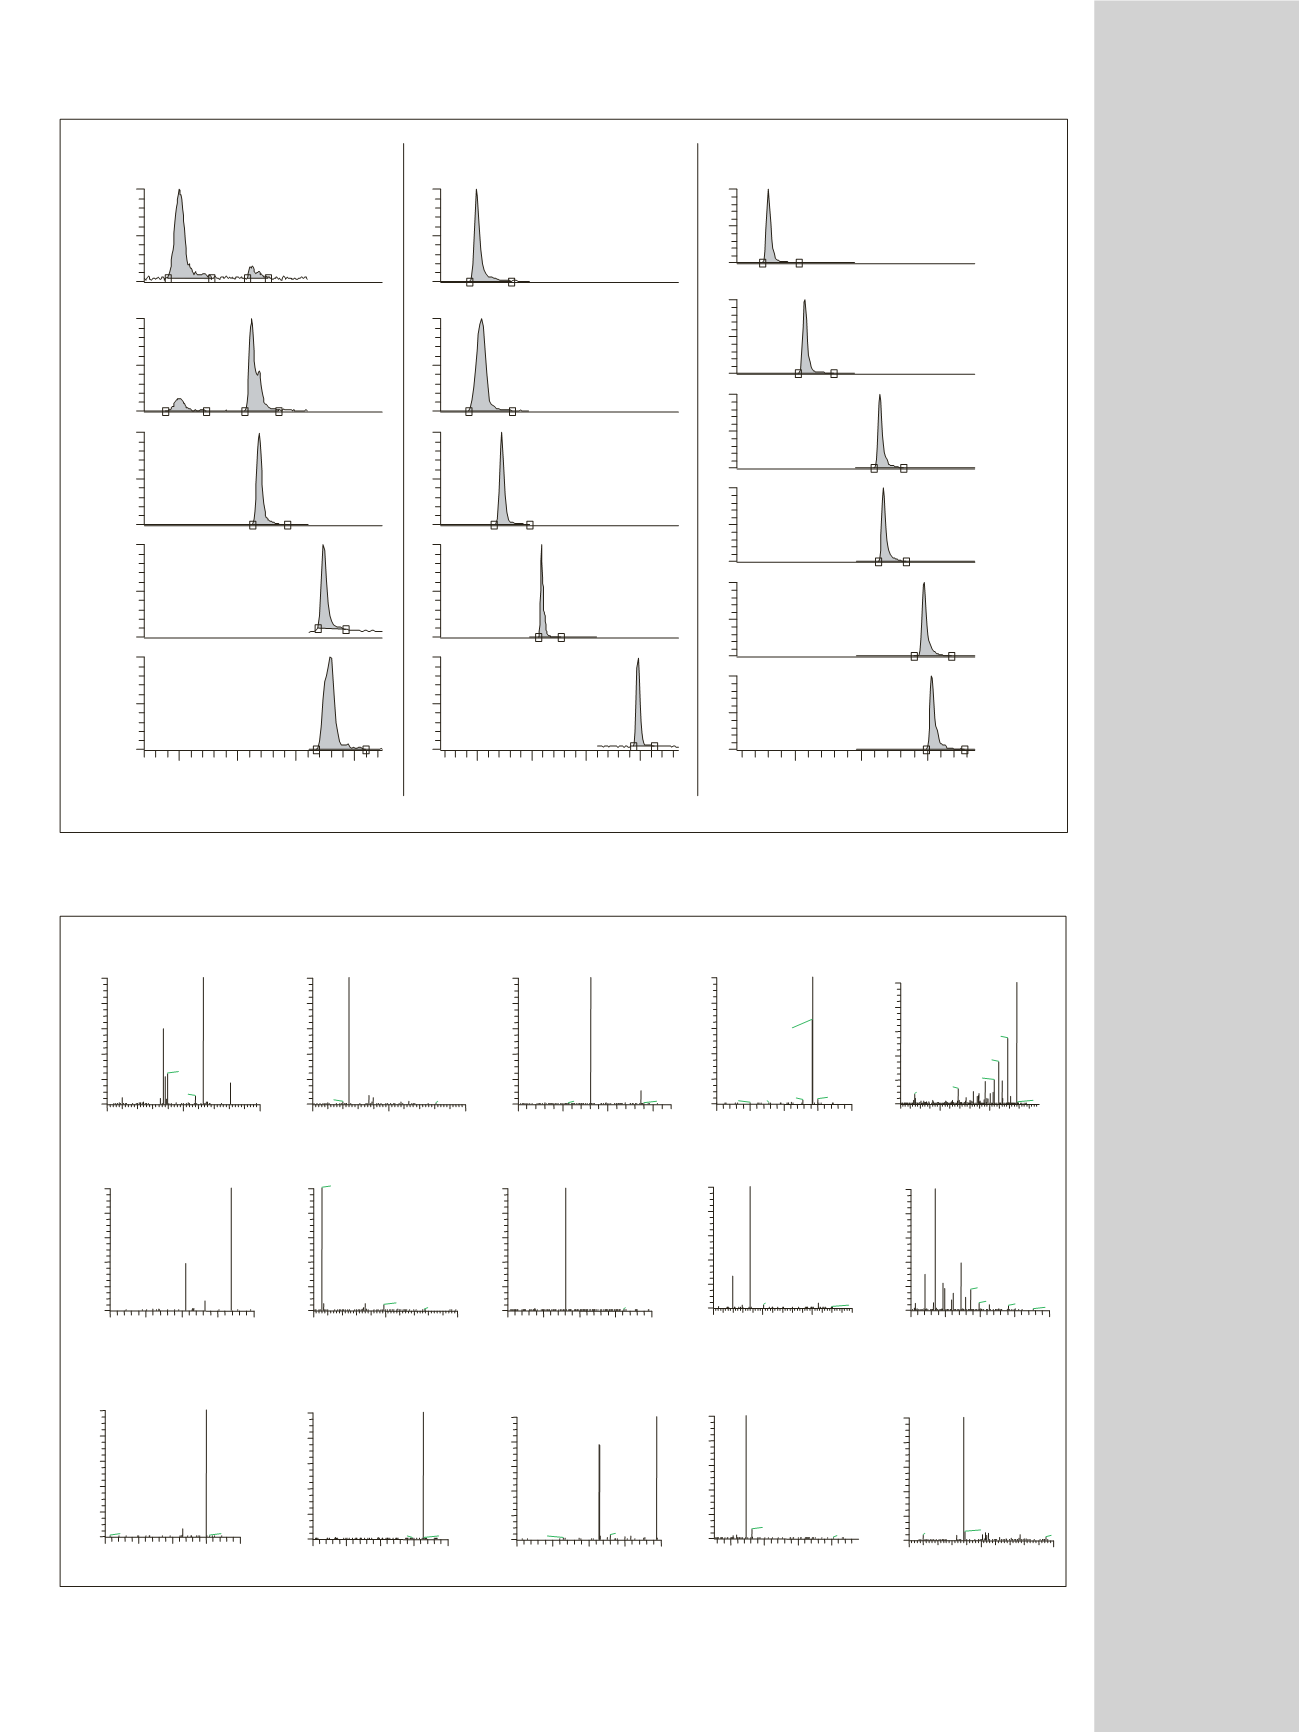
Figure 2: Reconstructed ion chromatograms, using the product ions listed in Table 1 (RIC column), from the analysis of 10 µL of the 50 pg/µL
standards in solvent
Chlorothiazide
Cromolyn-Na
Caffeine
100
150
200
m/z
0
20
40
60
80
100
137.97
138.98
177.00
109.93
195.01
100
150
200
250
300
m/z
0
20
40
60
80
100
293.87
213.86
229.92
186.81
164.76
200
300
400
500
m/z
0
20
40
60
80
100
244.91
262.97
424.89 505.47
100
150
200
250
300
m/z
0
20
40
60
80
100
249.86
214.99
254.62
165.12
107.95
100
150
200
250
300
0
20
40
60
80
100
263.94
196.79
134.02
264.96
247.16
Diclofenac
Flufenamic Acid
Indomethacin
Boldenone
100
150
200
250
300
m/z
0
20
40
60
80
100
135.02
172.97
186.97
199.02 241.07 276.88
100
200
300
m/z
0
20
40
60
80
100
174.00
138.88
311.96
201.97
339.67
RelativeAbundance
100
150
200
250
300
m/z
0
20
40
60
80
100
242.95
241.92
249.92
227.82
177.30
150.22
Meclofenamic Acid
Dexamethasone
200
300
400
m/z
0
20
40
60
80
100
355.03
337.03
319.08
309.10
237.03
148.92
356.96
Theobromine
Theophylline
Dyphylline
100
150
200
m/z
0
20
40
60
80
100
162.97
137.01
139.88
180.99
157.88
110.01
197.79
100
150
200
m/z
0
20
40
60
80
100
123.95
137.02
163.02
119.98
181.03
100
150
200
250
m/z
0
20
40
60
80
100
180.93
236.99
130.08
219.04
156.03
240.10
100
150
200
250
300
m/z
0
20
40
60
80
100
268.88
204.92
231.94
159.78
295.88
100
150
200
m/z
0
20
40
60
80
100
105.93
135.86 148.93 177.03
100
150
200
250
300
m/z
0
20
40
60
80
100
181.03
138.01
221.01 261.04
Hydrochlorothiazide
Pemoline
Pentoxifyline
m/z
Figure 3: Full-scan MS/MS spectra corresponding to compounds depicted in Figure 2


