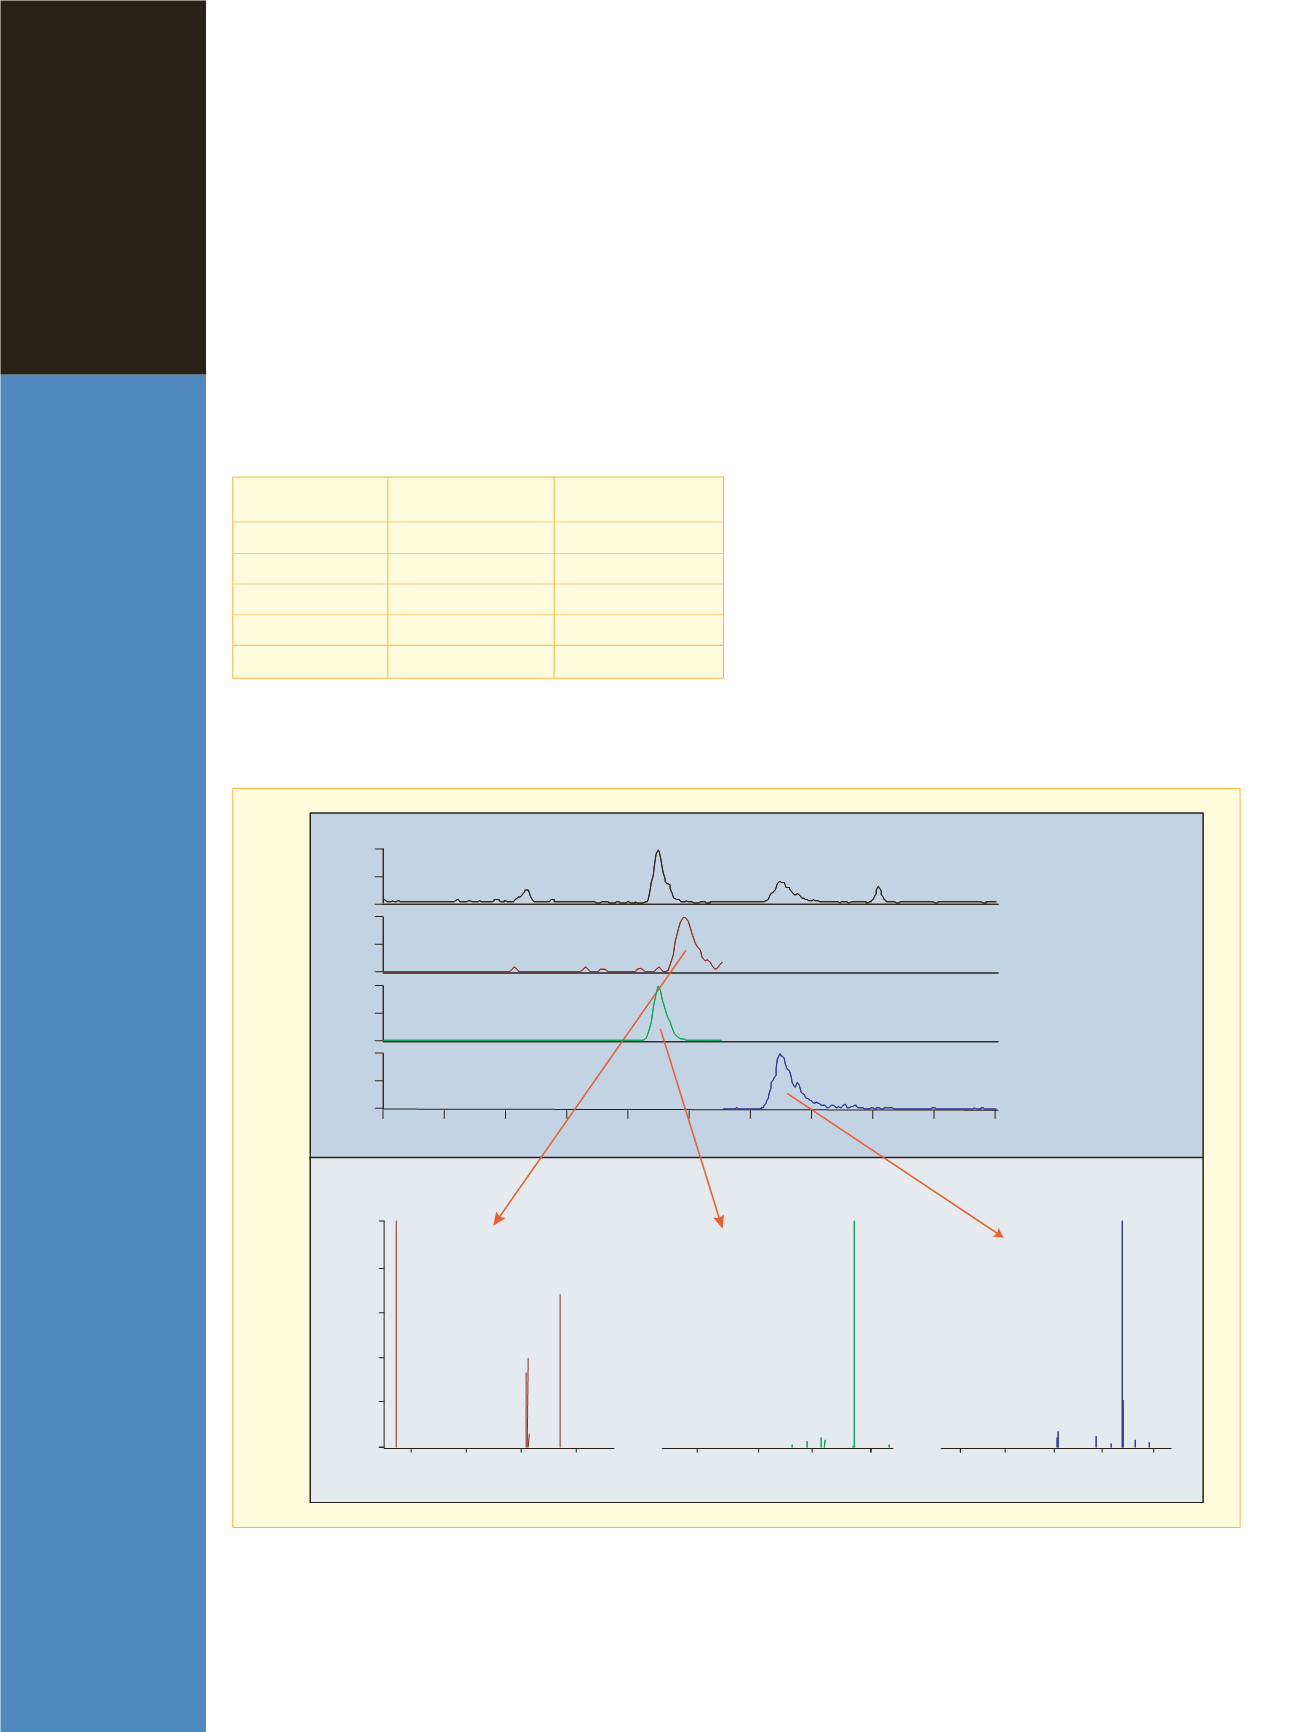

desipramine calibration curve. Figure 6 shows analysis
of imipramine and desipramine in horse urine sample
drawn two hours post-administration of the drug.
The amount of imipramine and its major metabolite
desipramine was determined using the calibration curves
shown in Figures 4 and 5. Table 2 shows the amount of
these two analytes as determined in horse urine. For the
sample drawn two hours post-administration of the drug,
the amount of imipramine and desipramine was deter-
mined to be 28 and 1567 ng/mL, respectively. The
amount of desipramine determined at this time is above
the upper limit of quantitation for the calibration curve
shown in Figure 5.
Identification of metabolites of imipramine
A urine sample from the race horse obtained two hours
after administration of the drug was also analyzed by
Data Dependent LC-MS/MS, with MS/MS on the top
two most intense ions to determine the presence of other
metabolites. Figure 7 shows the workflow for such an
analysis. The extracted ion chromatograms in Figure 8
show the presence of four additional metabolites:
desmethyl desipramine, OH desipramine, OH-imipramine,
and N-Oxide of imipramine, as well as their MS/MS frag-
mentation pattern. As indicated by the two peaks in the
extracted ion chromatogram for
m/z
297.2, imipramine
is metabolized to two metabolites that have the same
m/z
.
In this case, the MS/MS fragmentation pattern enables
unambiguous distinction between the two metabolites.
Page 6 of 8
Time
Imipramine
Desipramine
(hr)
(ng/mL)
(ng/mL)
0+
17.56
20.85*
2
28.12
1567.16**
4
4.25*
189.06
8
6.75*
96.56
24
6.11*
13.11*
Table 2: Determination of imipramine and desipramine in horse urine
for samples drawn at different times post injection of the drug
(*below lower limit of quantitation, **above upper limit of quantitation)
4
5
6
7
8
9
10
11
12
13
14
Time (min)
100
100
100
100
8. 47
10. 46
8. 88
8. 47
10. 46
NL: 1.03E5
Base Peak MS
NL: 5.95E3
m/z
=85.5-86.5
NL: 1.75E5
m/z
=235.5-236.5
NL: 4.21E4
m/z
=269.5-270.5
T: + c ESI Full ms2 281.20@30.00
[75.00-285.00]
m/z
m/z
m/z
100 150 200 250
0
20
40
60
80
100 86.0
236.1
206.0
100
150 200
250
236.0
100 150 200 250 300
270.0
Imipramine
Desipramine
0
Relative Abundance
Relative Abundance
Base Peak
Imipramine
Desipramine
Clomipramine
Clomipramine
T: + c ESI Full ms2 267.20@30.00
[75.00-270.00]
T: + c ESI Full ms2 315.20@35.00
[85.00-320.00]
Figure 6: Analysis of imipramine and desipramine in horse urine for sample drawn two hour post-administration of drug


