
Page 3 of 8
Time (min)
100
100
100
100
11.51
11.51
9.55
9.12
9.09
9.53
NL: 1.74E6
NL
NL
NL
Base peak
Desipramine
Imipramine
Clomipramine
m/z
m/z
m/z
m/z
150
200
250
300
150
200
250
300
150
200
250
300
0
100
100
300
500
0
100
236.0
236.0
242.1
270.0
85.9
: 8.23E5
m/z
=266.5-267.5
: 7.63E5
m/z
=280.5-281.5
: 9.22E5
m/z
=314.5-315.5
MS/MS
Spectra
267.0
216.9
162.9 216.8
227.6
281.0
162.9
278.9
216.9 236.0
162.9
5.0
5.5
6.0
6.5
7.0
7.5
8.0
8.5
9.0
9.5 10.0 10.5 11.0 11.5 12.0 12.5
m/z
100
300
500
m/z
100
300
500
MS Spectra
T: + c ESI Full ms [150.00-320.00]
T: + c ESI d Full ms2 315.03@35.00
[75.00-645.00]
T: + c ESI d Full ms2 281.03@35.00
[65.00-575.00]
T: + c ESI d Full ms2 267.01@35.00
[60.00-545.00]
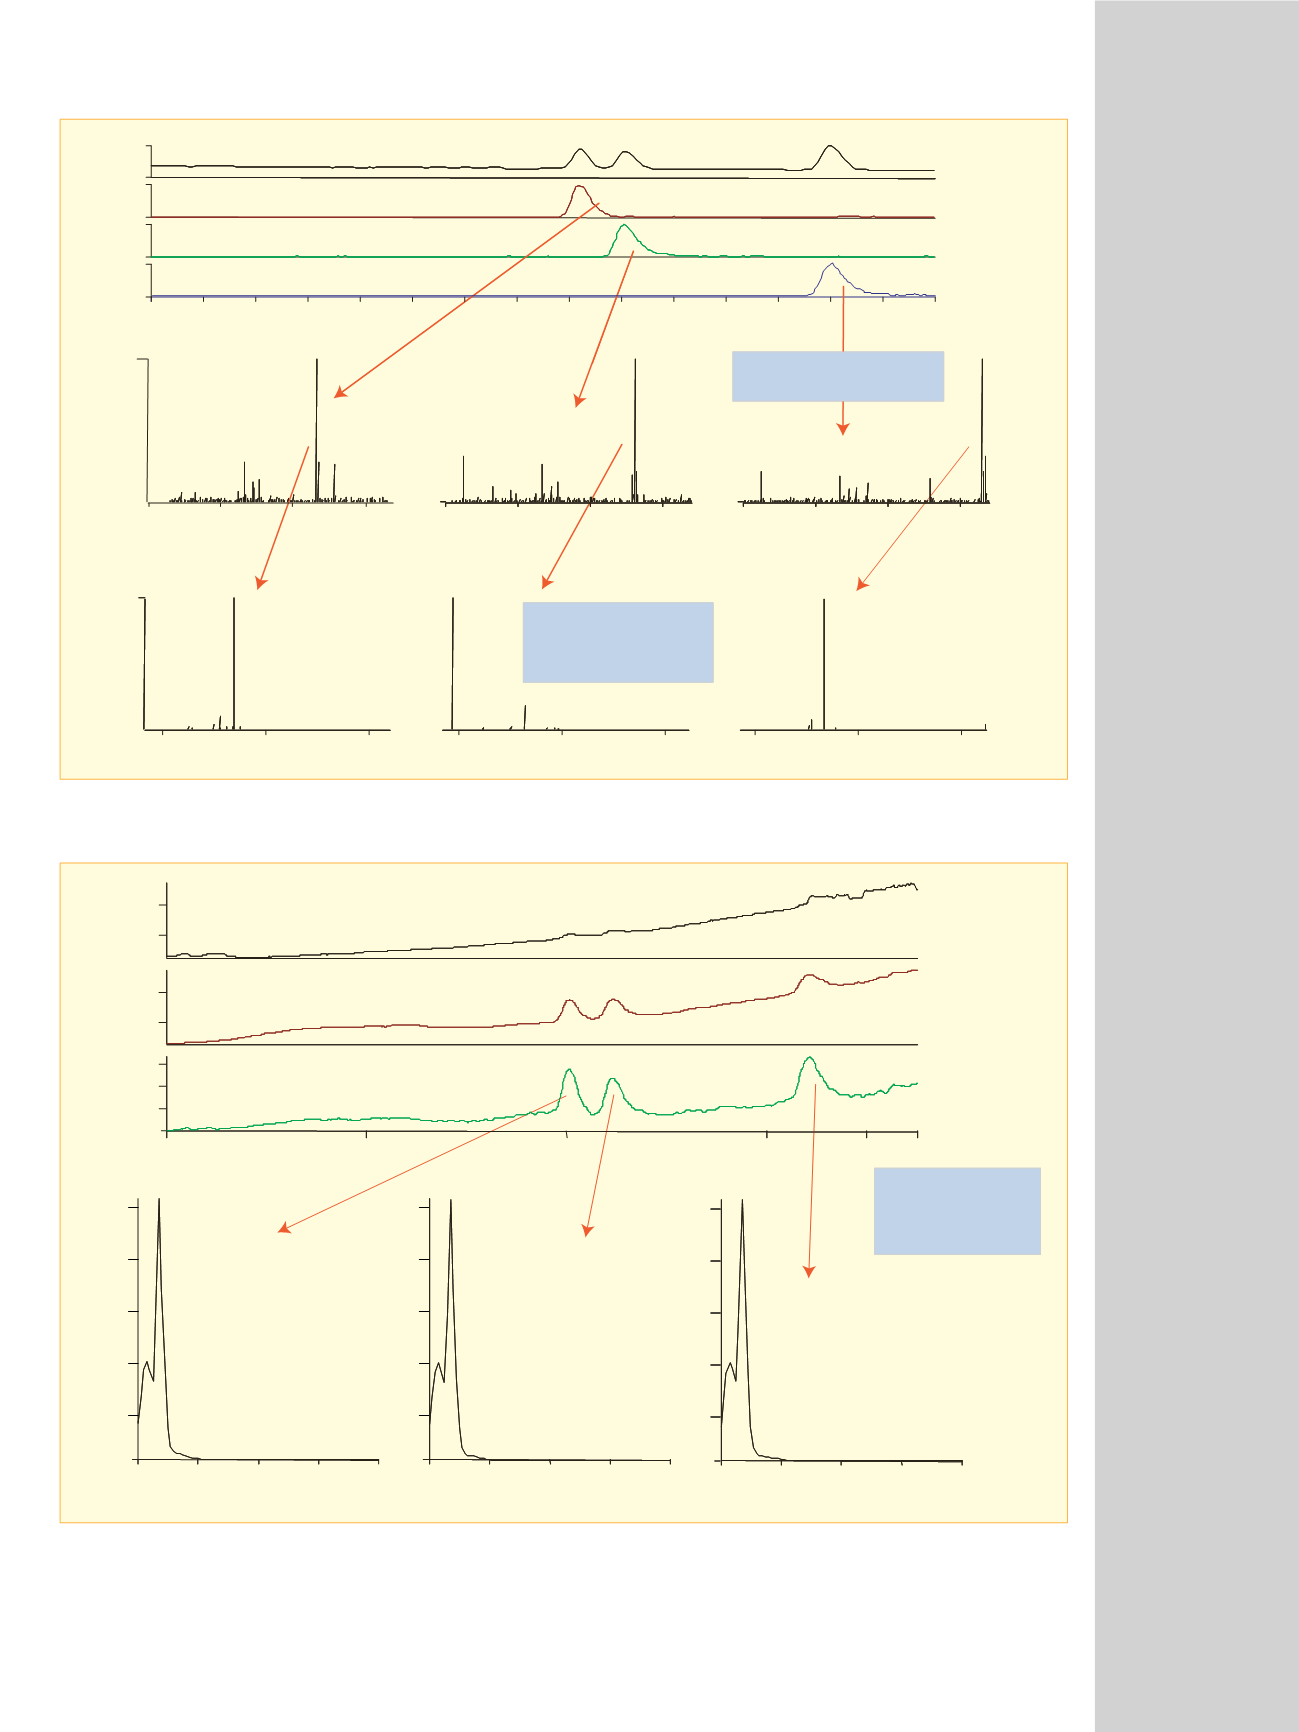
Figure 1: LC-MS/MS analysis of imipramine, desipramine and clomipramine (internal standard)
0
NL: 2.754E4
UV @ 254 nm
NL: 6.75E3
UV @ 280 nm
NL: 2.1E4
Total Scan PDA
0
20
40
60
80
100
235.0
235.0
235.0
UV
Spectra
Desipramine
Imipramine
Clomipramine
UV @ 280 nm
UV @ 254 nm
Total Scan
20000
10000
uAU
20000
10000
uAU
6000
4000
2000
uAU
Relative Absorbance
0
20
40
60
80
100
0
20
40
60
80
100
200 300 400 500 600
wavelength (nm)
200 300 400 500 600
wavelength (nm)
200 300 400 500 600
wavelength (nm)
5.0
7.0
9.0
9.02 9.45
9.03 9.46
11.0
12.0 12.5
Time (min)
11.43
11.43
Figure 2: LC-UV analysis of imipramine, desipramine and clomipramine (internal standard)


