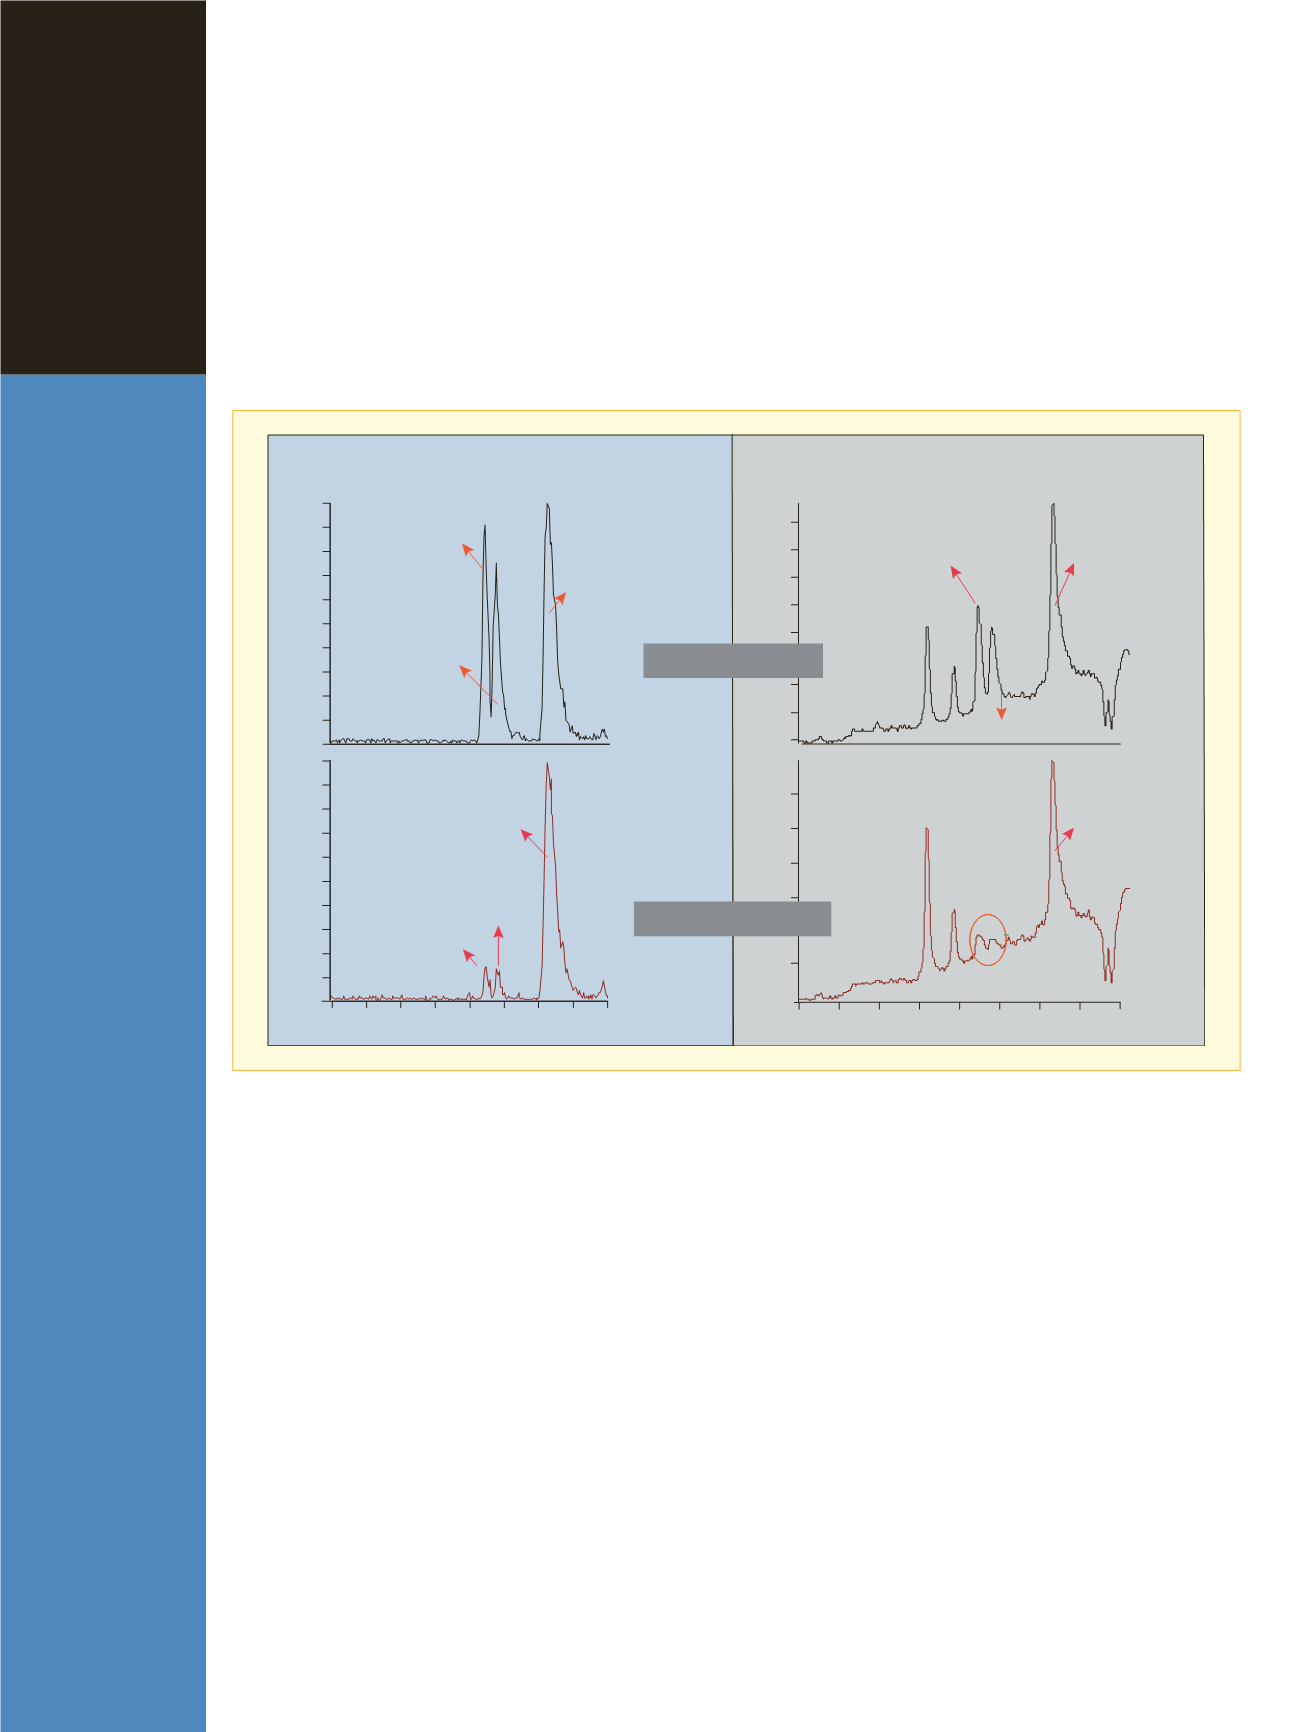

Figure 3 shows chromatograms obtained for the
analysis of imipramine, desipramine and clomipramine
(IS) with MS and UV detection at levels of 5 and 0.5 ng
on-column. At 0.5 ng on-column, both imipramine and
desipramine could be easily identified when MS was used
as a detector whereas these analytes were hardly visible
in the UV trace. The concentration of clomipramine is
the same at both these levels. This illustrates the excel-
lent sensitivity that can be obtained during analysis by
LC-MS/MS.
Quantitation of imipramine and desipramine
in horse urine
Figures 4 and 5 show calibration curves obtained for
imipramine and its major metabolite desipramine in horse
urine with clomipramine used as an internal standard.
The coefficient of correlation is 0.9896 for calibration
curve of imipramine and 0.9836 for the calibration curve
of desipramine. The % CV values are less than 7% for
the imipramine calibration curve and 15% for the
Page 4 of 8
10.26
8.45
8.78
10.25
0
4000
6000
8000
10000
0
2000
6000
8000
10000
12000
14000
10.16
8.36
7.13
8.69
7.77
11.01
10.15
7.12
7.76
4
5
6
7
8
9
10 11 12
? ? ?
uAU
uAU
MS Detection
Desipramine
Desipramine
Desipramine
Imipramine
Imipramine
Clomipramine
Clomipramine
Clomipramine
Clomipramine
UV Detection
Time (min)
4
5
6
7
8
9
10
11
12
Time (min)
5 ng on-column
0.5 ng on-column
100
90
80
70
60
50
40
30
20
10
0
100
90
80
70
60
50
40
30
20
10
0
Imipramine/
Desipramine
NL: 2.15E6
m/z
=266.7-267.7+280.7-
281.7+314.7-315.7
F: + c ESI Full ms
[150.00-320.00]
NL: 1.76E6
m/z
=266.7-267.7+280.7-
281.7+314.7-315.7
F: + c ESI Full ms
[150.00-320.00]
NL: 1.51 E4
UV @ 280 nm
NL: 1.27 E4
UV @ 280 nm
Imipramine
Figure 3: Comparison of MS and UV detection at two different concentrations


