
Page 7 of 8
Optimize MS parameters
by tuning Imipramine
Setup LC Parameters
Mobile phase, column, gradient
Full-scan LC-MS/MS analysis
of the sample with MS/MS on the
top n (in this case top 2) peaks
Data analysis using Metabolite ID
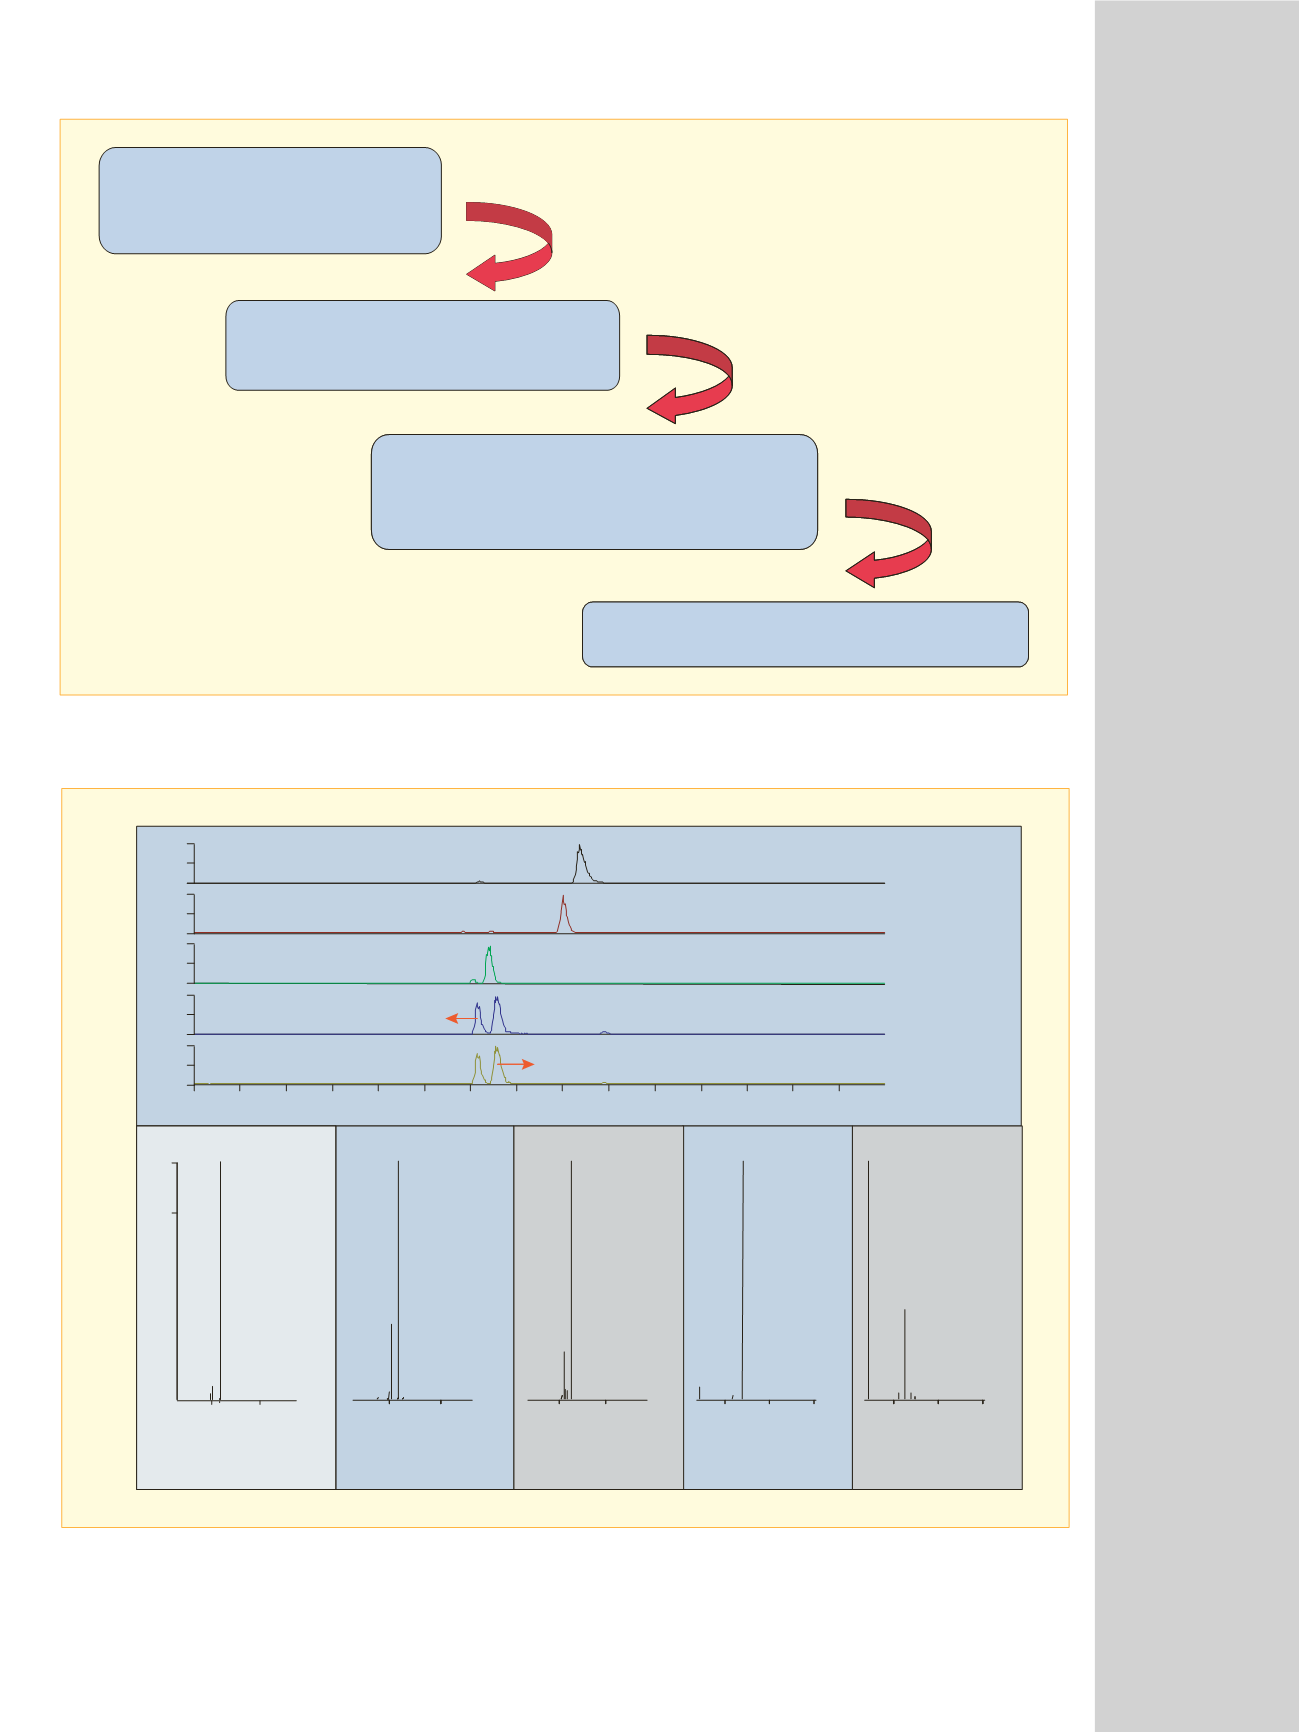
Figure 7: Workflow for the identification of imipramine and its metabolite in horse urine
Time (min)
8.36
0
1
2
3
4
5
6
7
8
9
10
11
12
13
14
0
100
100
100
100
100
6.42
8.01
6.56
6.52
6.56
6.52
200 400
200 400
200 400 600
200 400 600
252.0
223.9
279.0
86.0
85.9
252.0
279.1
200 400
208.0
196.2
NL: 3.05E6
m/z
=266.7-267.7
NL: 1.43E6
m/z
=252.5-253.5
NL: 1.13E7
m/z
=282.7-283.7
NL: 7.98E6
m/z
=296.7-297.7
NL: 7.98E6
m/z
=296.7-297.7
Desipramine
OH-Desipramine
OH-
Desipramine
OH-Imipramine
OH-
Imipramine
N-oxide of Imipramine
N-oxide of
Imipramine
Demethyl-Desipramine
Demethyl-
Desipramine
100
208.1
196.0
m/z
m/z
m/z
m/z
m/z
0
20
40
60
80
236.0
236.0
Relative Abundance
Relative Abundance
T: + c ESI d Full ms2
268.07@35.00 [60.00-540]
T: + c ESI d Full ms2
253.07@35.00 [55.00-520]
T: + c ESI d Full ms2
283.12@35.00 [65.00-580]
T: + c ESI d Full ms2
297.15@35.00 [70.00-605]
T: + c ESI d Full ms2
297.12@35.00 [70.00-605]
200 400
Desipramine
Figure 8: Data Dependent LC-MS/MS analysis of metabolites of imipramine


