
Mass Spectrometry conditions
MS analysis was carried out on an Exactive benchtop
mass spectrometer with an electrospray ionization (ESI)
source (Figure 1). The MS conditions were as follows:
Ion Polarity:
Polarity switching scan
dependent experiment
Spray Voltage:
4500 V in positive mode and
–3900 V in negative mode
Sheath gas pressure (N
2
):
45 (arbitrary units)
Auxiliary gas pressure (N
2
): 3 (arbitrary units)
Capillary temperature:
300 °C
Resolution:
50,000 (FWHM)
AGC Target Value
500,000
Results and Discussion
The screening method was set up for the identification and
confirmation of more than 100 compounds, including
anabolic agents, steroids, anesthetics, anti-inflammatory
agents, and diuretics, as listed in Table 1
4
6
8
10
12
14
16
18
20
22
24
26
Time (min)
0
100
0
100
15.95
11.41
18.45
10.49
12.54
15.94
3.31
8.44
5.57 6.45
9.36
16.13
10.48
4
6
8
10
12
14
16
18
20
22
24
Time (min)
0
100
0
100
RelativeAbundance
16.19
3.52 4.28
16.17
19.51
13.47
4.426.16
4
6
8
10
12
14
16
18
20
22
24
0
100
0
100
17.13
17.14
16.89
4.956.278.97
4
6
8
10
12
14
16
18
20
22
24
Time (min)
0
100
0
100
23.58
9.57
12.09
24.82
6.40
19.74
5.90
6.57
14.0217.13
23.57
9.60
23.84
17.85
22.81
21.05
2
Triamcinolone Acetonide
Triamcinolone
Flumethasone
Dexamethasone
MH
+
C
22
H
28
FO
5
m/z
393.20718
FormiateadductC
23
H
31
F
1
0
7
m/z
437.19701
MH
+
C
22
H
28
F
2
O
5
m/z
411.19776
FormiateadductC
23
H
30
F
2
O
7
m/z
455.18759
MH
+
C
24
H
31
FO
6
m/z
435.21774
FormiateadductC
25
H
33
FO
8
m/z
479.20757
FormiateadductC
22
H
27
FO
8
m/z
439.17627
MH
+
C
21
H
27
FO
6
m/z
395.18644
0
5
10
15
20
25
30
Time (min)
0
20
40
60
80
100
0
20
40
60
80
100
Relative Abundance
2.05
15.92
22.03
15.93
2.79
3.17 4.69
9.60
1.98
8.22
MH
+
C
22
H
28
FO
5
m/z
393.20718
FormiateadductC
23
H
31
F
1
0
7
m/z
437.19701
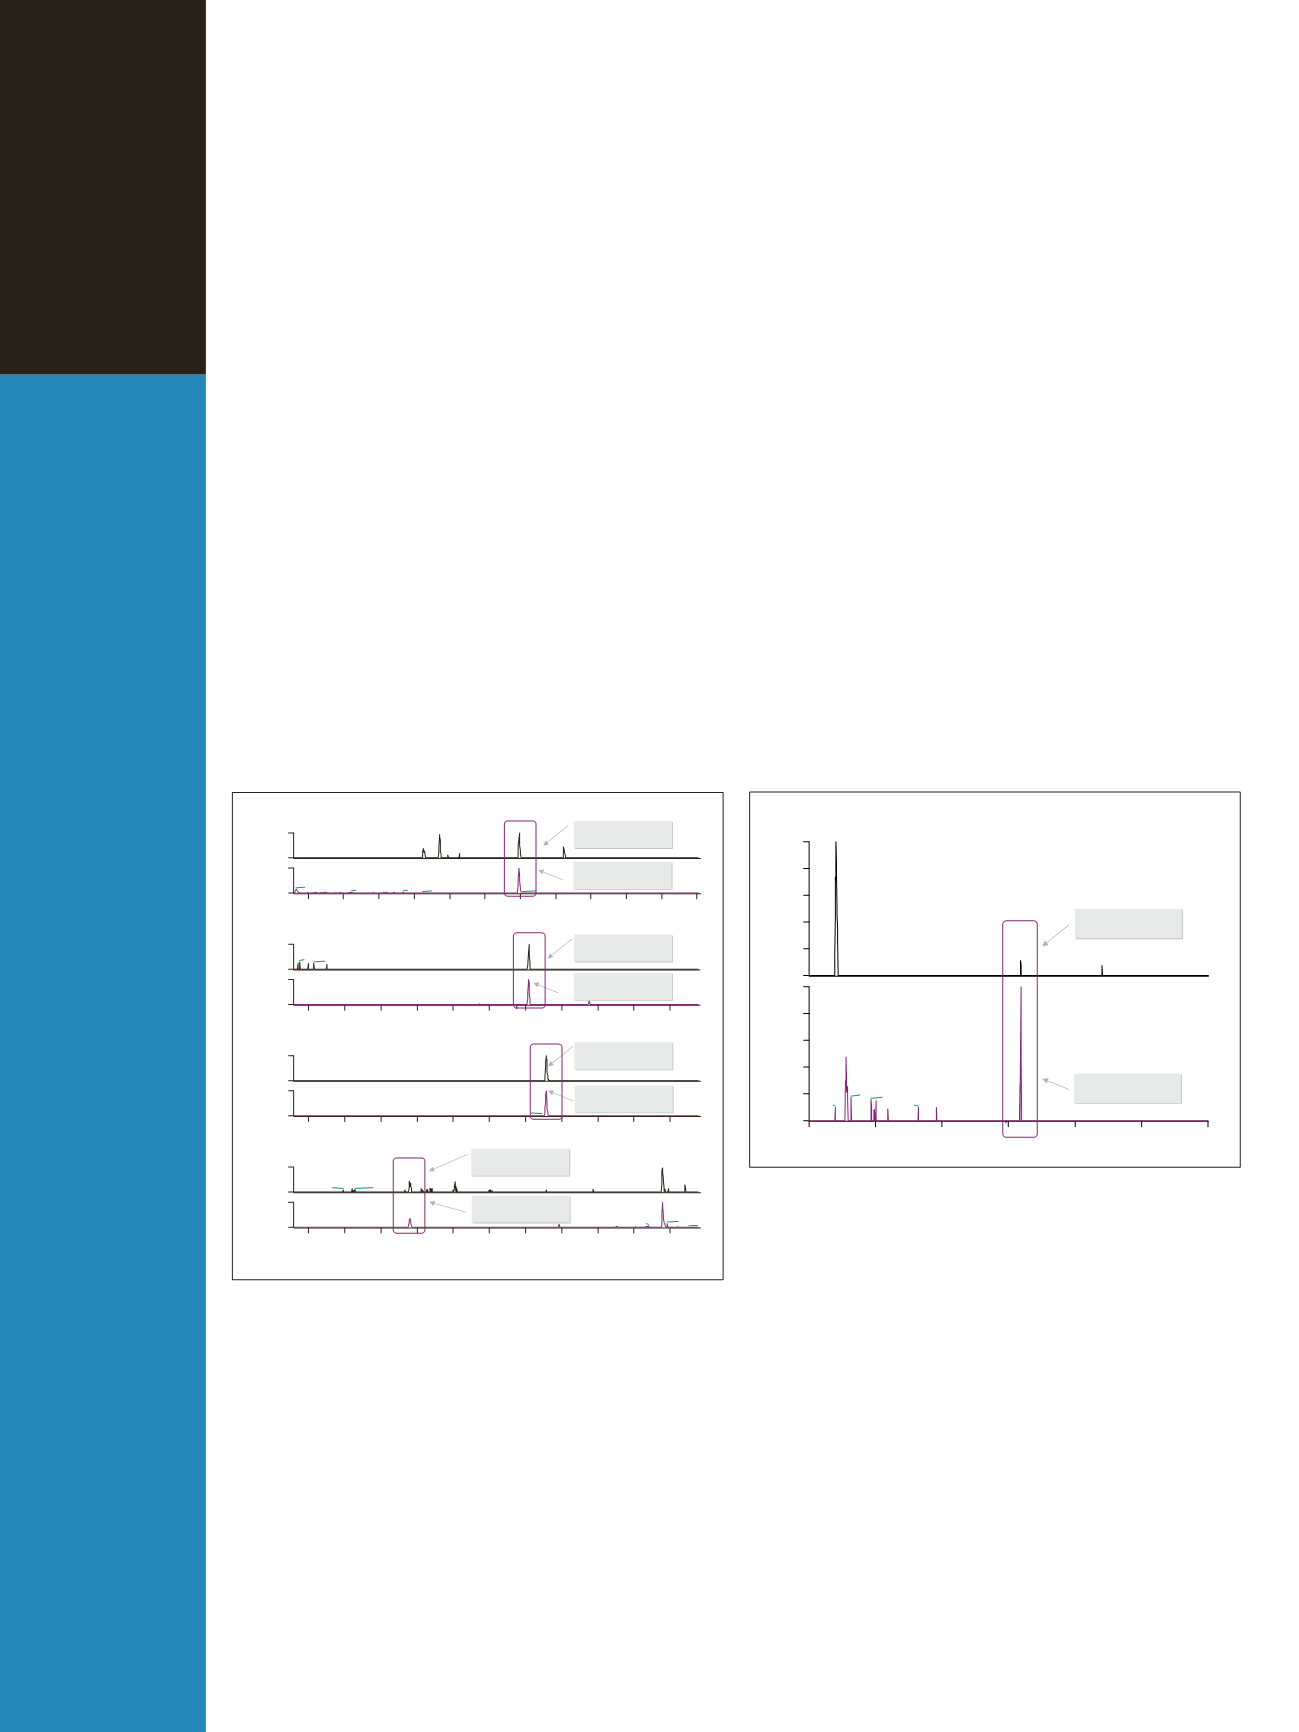
Figure 2: Extracted ion chromatograms for dexamethasone, flumethasone, tri-
amcinolone acetonide, and triamcinolone in the positive and negative modes
using 5 ppm mass accuracy
Figure 3: Dexamethasone identified in a real sample in positive and negative
mode
Acquisition was performed using the full MS scan mode
with polarity switching and external calibration. All data
were reprocessed using 5 ppm mass accuracy. Figure 2
shows the sensitivity obtained for a urine sample spiked
with 4 compounds: dexamethasone, flumethasone, triam-
cinolone acetonide, and triamcinolone. The injected con-
centrations were 50 pg/mL for dexamethasone and
flumethasone and 1 ng/ml for triamcinolone and triamci-
nolone acetonide. In the positive mode, the analytes were
identified as protonated species and in the negative mode,
as formate adducts. As data acquired was in full scan MS
mode, re-interrogation of the data file, particularly for
non-targeted or unknown compounds or metabolites, is
easily made possible.
Thousands of real urine samples have been analyzed
using this approach. Figure 3 shows an example of a real
sample that has been analyzed using this method.
All data have been processed using Thermo Scientific
ToxID software. ToxID
™
software for Exactive processes
data using the mass accuracy and retention time of the
analytes. An example of the automatically generated
report can be seen in Figure 4.


