
3
The MS/MS experiments on
m/z
505.29 resulted in three
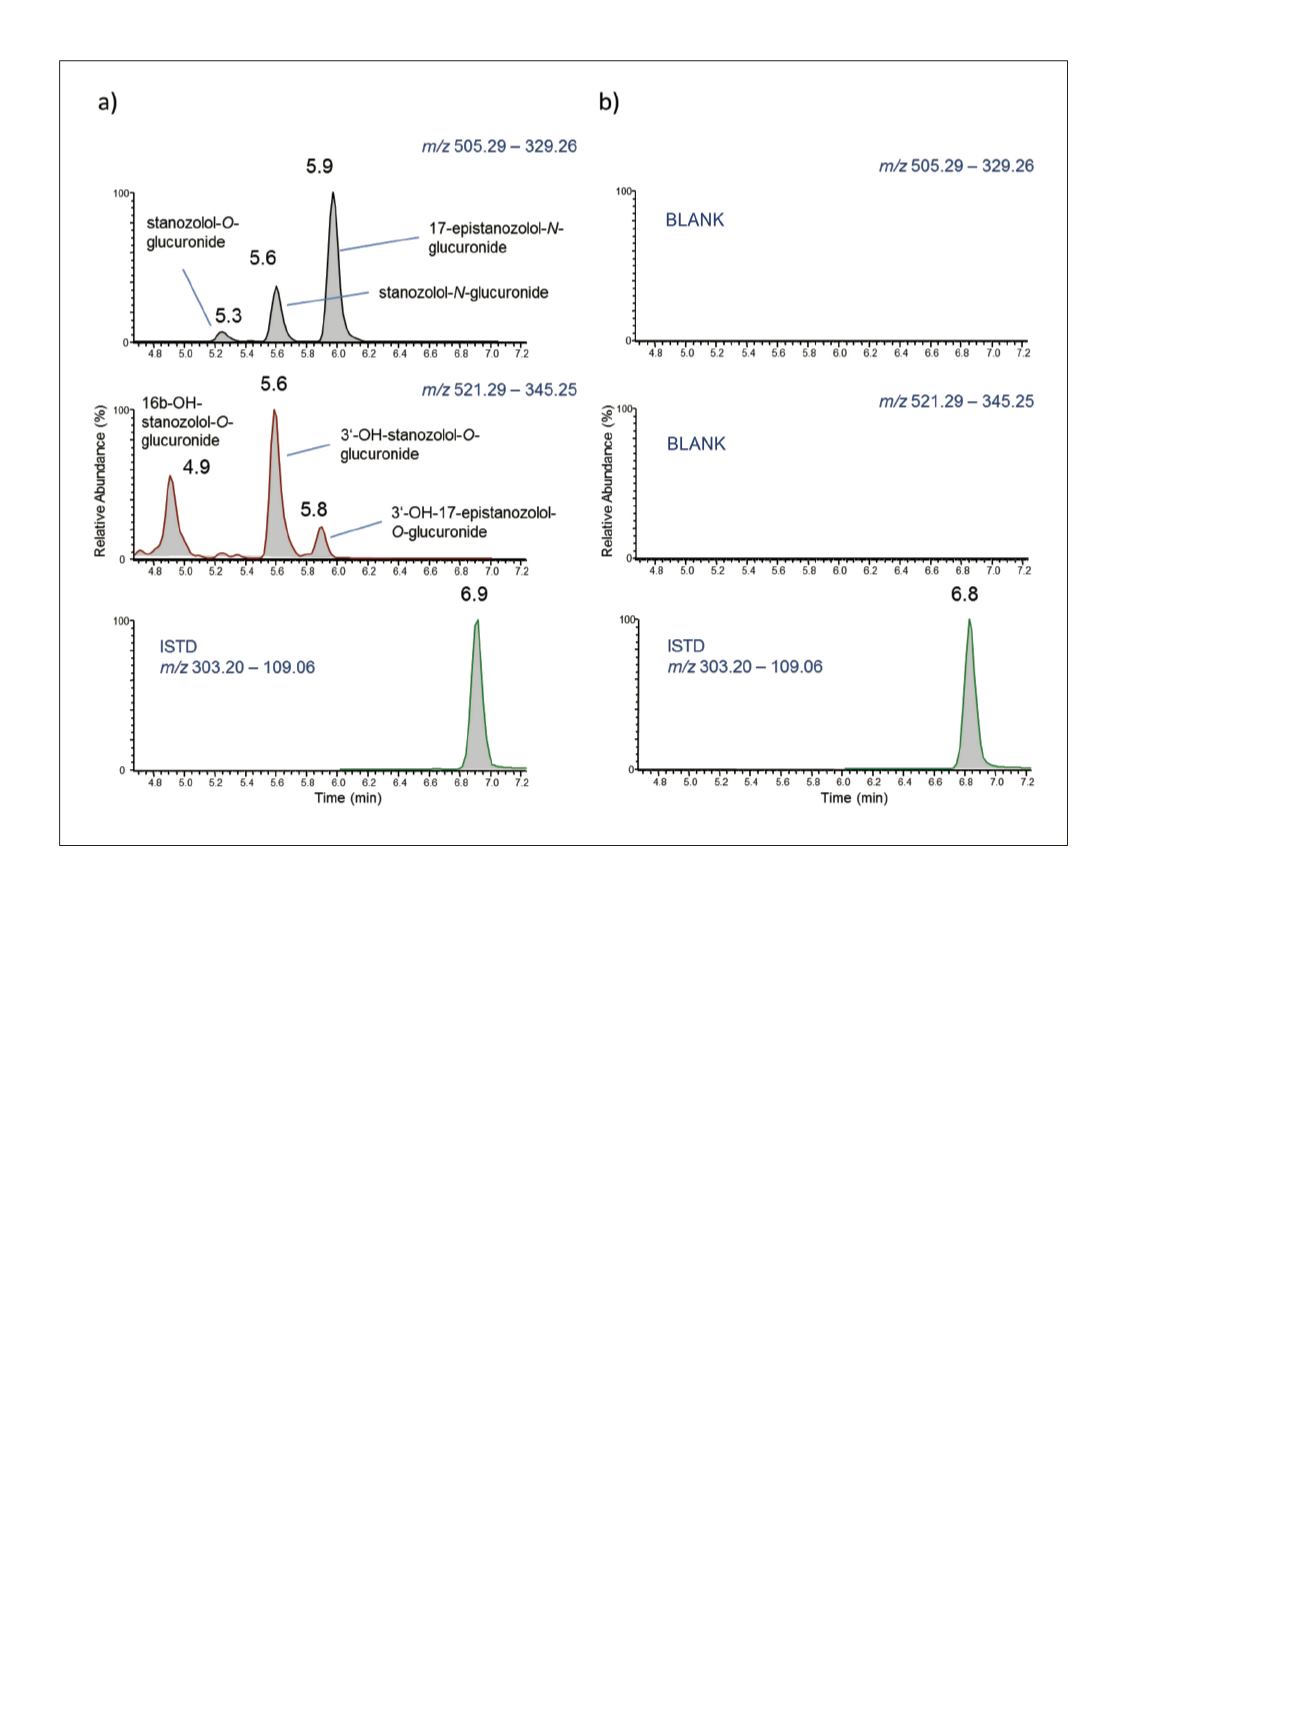
distinct signals as depicted in Figure 2a (top). Stanozolol
comprises a hydroxyl group at C-17 and was thus expected
to produce a glucuronic acid conjugate; however, the origin
of the two additional species of identical sum formula was
to be clarified and the structure of the 17-
O
-glucuronidated
compound to be verified. Therefore, a urine sample
containing predominantly the substances eluting at 5.14
and 5.53 min (3 h post-administration sample) was
subjected to enzymatic hydrolysis with
β
-glucuronidase
that reportedly cleaves
β
-
O
-glucuronic acid conjugates of
steroids.
2
Following hydrolysis, the urine sample was
reanalyzed, demonstrating the disappearance of peak 1
(5.14 min), while peak 2 (5.53 min) remained at its initial
abundance (Figure 3a, top). Hence it was concluded that
peak 1 corresponded to the hydrolysable
17-
O
-glucuronide of stanozolol while peak 2 was attributed
to a nonhydrolysable glucuronic acid conjugate bearing
the glucuronide moiety at a nitrogen atom of the pyrazole
residue. The product ion mass spectra of the analytes are
depicted in Figure 3b and did not reveal significant
differences that would allow localization of the
conjugation site. However, the putative stanozolol-
O
-
glucuronide (Figure 3b, top) required more collision
energy to dissociate (CE = 45 eV) than the corresponding
stanozolol-
N
-glucuronide (Figure 3b, middle) and
17-epistanozolol-
N
-glucuronide (Figure 3b, bottom),
which were collisionally activated with 35 eV only. Under
increasing CE values (as shown in the insets measured at
CE = 65 eV), both
N
- and
O
-conjugated metabolites
yielded the diagnostic product ions of stanozolol
(e.g.
m/z
81.0452).
Figure 2. Extracted ion chromatograms of a) post-administration sample (5 days after administration of 5 mg of stanozolol) and b)
blank urine sample. Considering accurate masses of precursor and product ions, hydrolysis experiments, and comparison to reference
standards, structures were shown as indicated next to each peak.


