
standards. Three of the four peptides showed a positive
response with little signal attributed to the T
6
peptide at
the 72 hour time point. Although the response for the
T
4
peptide does not appear to be measurable, closer
inspection shows an integrated peak area over 2000
counts observed to have the same retention time as that
for the labeled T
4
peptide at 7.27 minutes.
Comparison of chromatographic retention times for
the administered rhEPO study with the spiked rhEPO
study (Figure 2) showed excellent chromatographic
reproducibility, with retention times that shifted less than
6-10 seconds, enabling an additional means of confirma-
tion for the presence of rhEPO in the extracted horse
plasma. Based on the integrated peak area ratios for the
three detected rhEPO biomarkers, a total of ca. 0.05 ng/mL
was present in the horse plasma following a 72-hour delay
between rhEPO administration and sample collection. Com-
parison of LC-MS/MS results with those measured using
ELISA show similar levels (0.04 ng/mL–data not presented)
indicating excellent agreement between the two methods.
Using a stable-isotope labeled internal standard
provides two clear advantages: identification of the correct
retention times, as shown above, and determination of the
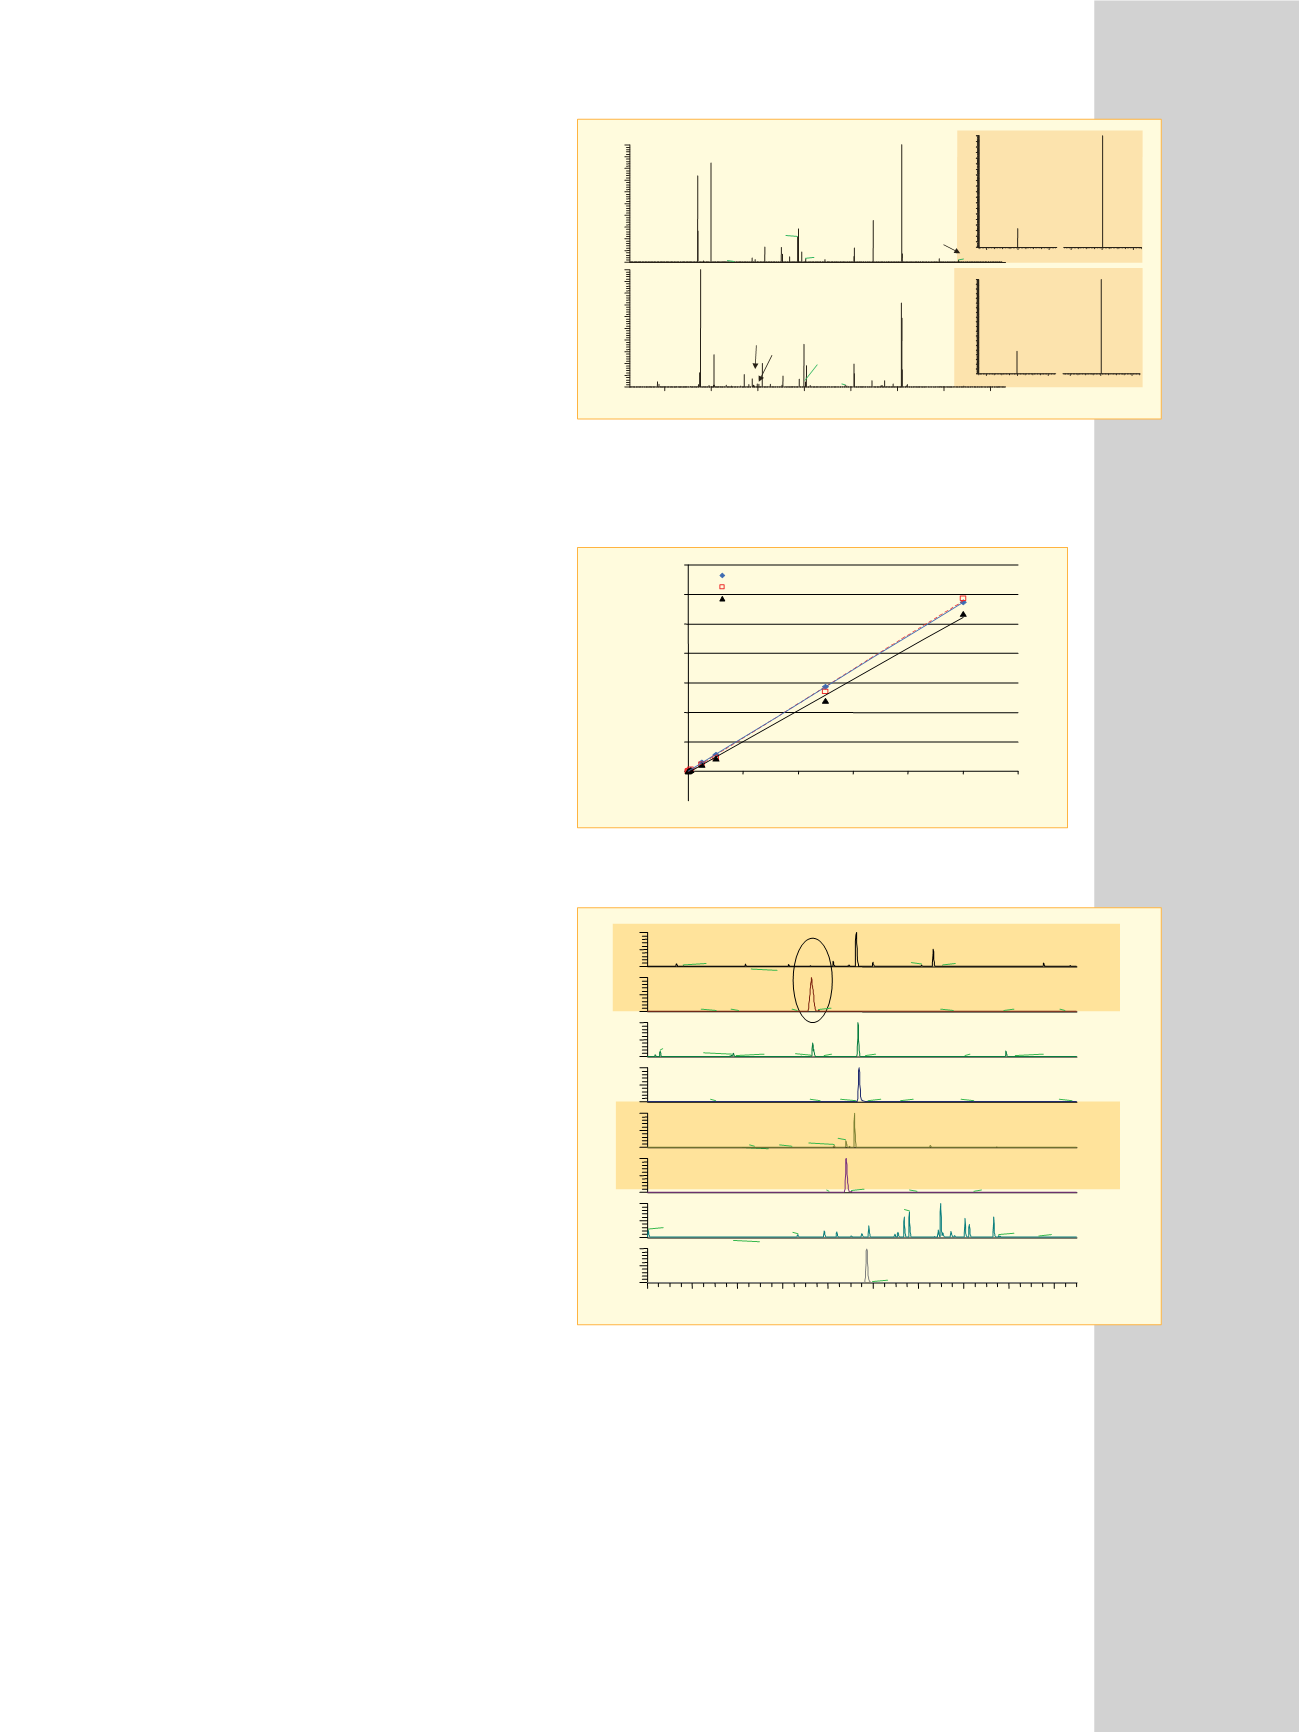
correct ion ratio for the monitored product ions. Figure 3
demonstrates the consistency of the ion ratios measured
following CID for both full scan MS/MS detection as well
as SRM analysis for the T
11
labeled and unlabeled rhEPO
peptides. The same measurements can be used to confirm
the presence of rhEPO at each time point. Figure 6 shows
the measured ion abundance for the y
4
and y
5
fragment
ions for the unlabeled and labeled T
4
peptides at the time
points of 72, 10, and 0.5 hrs following the final rhEPO
administration. The measured ion ratios for the unlabeled
T
4
peptides were consistently between 20 and 25% while
the ratio for the labeled T
4
peptide was consistently
between 30 and 35%. The slight increase in the ratio for
the labeled peptide was observed for the three other pairs
of signature peptides (see Figure 3).
Figure 7 shows the calculated rhEPO concentration in
the extracted horse plasma samples for T
4
and T
6
peptides. The levels were calculated using the integrated
area ratios between the targeted rhEPO peptide and their
corresponding labeled internal standards. The calculated
concentration for two targeted peptides agree with those
obtained using two different labeled standards to monitor
the concentration of rhEPO in the test sample. In addition
to mass spectral determination, ELISA was also used to A)
predict the presence of rhEPO and B) calculate the level
of rhEPO in plasma at each time point. The ELISA results
nicely corresponded with those calculated using the tar-
geted SRM approach; in fact, the levels estimated at 48 and
72 hours agreed well (0.06 and 0.04 ng/mL, respectively),
increasing the confidence in the calculated concentrations.
0
01
02
03
04
05
06
07
08
09
001
RelativeAbundance
0
01
100
200
300
400
500
600
700
800
02
03
04
05
06
07
08
09
001
RelativeAbundance
1.306
2.102
0.371
1.345
2.583
8.383
8.413
1.205
0.882
1.104
9.186
4.227
8.275
0.052
9.971
2.306
6.693
0.802
2.205 2.104
4.172
8.253
1.765
3.88
8.416
2.484
1.882
b
2
b
2
a
2
a
2
y
2
y
2
y
3
y
3
y
4
y
5
y
5
y
4
b
3
)A3
)B3
y
6
003.205
004.306
100
90
80
70
60
50
40
30
20
10
0
100
90
80
70
60
50
40
30
20
10
0
RelativeAbundance
03.205
04.306
004.306
m/z
m/z
03.205
04.306
003.205
Unlabeled
Labeled
m/z
Figure 3: Comparative Quantitation Enhanced Data-Dependent
™
MS/MS
spectra for 3A) unlabeled and 3B) labeled T
11
peptides at 50 fmol on column.
The inset shows the measured ion intensity for the SRM transitions for the
unlabeled and labeled T
11
peptides at 500 amol on column.
Actual Amount on Column (fmol)
Calculated Quantity
on Column (fmol)
0
200
400
600
800
1000
1200
1400
0
200 400 600 800 1000 1200
T4
T11
T17
Figure 4: Quantification curve for neat rhEPO analysis. The calculated levels
were determined using area ratios of the labeled analogues.
T4
YLLEAK
T11
SLTTLLR
T17
VYSNFLR
T6
VNFYAWK
Heavy rhEPO
rhEPO
Heavy rhEPO
rhEPO
Heavy rhEPO
rhEPO
Heavy rhEPO
rhEPO
0
2
4
6
8
10
12
14
16
18
Time (min)
RelativeAbundance
0
50
100
0
50
100
0
50
100
0
50
100
0
50
100
0
50
100
0
50
100
0
50
100
9.25
12.65
8.23
9.99
17.53
1.30
4.35
6.25
12.14
1.60
13.07
15.65
7.27
7.58
33.01
86.0
6.63
67.51 56.41
20.5
18.49
4.04
13.54
3.05
9.33
7.32
0.57
15.87
3.81
3.73
7.23
3.94
7.81
16.29
9.66
12.71 14.05
9.37
9.22
9.77
1.15
18.80
7.65
02.11
18.5
01.4
15.47
14.45
3.03
9.17
8.79
8.27
12.53
15.46
6.43
10.96
3.05
1.50
4.74
18.07
8.81
9.04
22.31
69.2
11.95
8.04
5.47
1.11
17.16
14.45
12.98
11.59
15.32
9.80
0.05
7.83
6.66
15.54
33.71
39.4
30.3
9.72
9.96
17.90
8.01
93.51
82.31
86.4 11.3
47.0
6.28
NL: 2.49E3
NL: 1.95E5
NL: 3.75E3
NL: 3.87E5
NL: 2.36E3
NL: 1.04E5
NL: 4.06E2
NL: 1.21E5
Figure 5: Summed SRM chromatograms for the four targeted rhEPO peptides
and their labeled derivatives for the horse plasma extraction sample
collected 72 hours following rhEPO administration.


