
4
The initial list of transitions was queried empirically to
produce an LC-MS/MS profile based on four tryptic peptides
that collectively spanned >50% (45 of 84 amino acids) of the
full PTH sequence. SVSEIQLMHNLGK [amino acid
(aa)1–13] was monitored to represent PTH species with an
intact N-terminus, such as PTH1–84. Other tryptic peptides,
HLNSMER (aa14 –20), DQVHNFVALGAPLAPR (aa28–
44), and ADVNVLTK (aa73–80) were included for
monitoring across the PTH sequence. In addition, transitions
for two truncated tryptic peptides, LMHNLGK (aa7–13)
and FVALGAPLAPR (aa34–44), were added to the profile to
monitor for truncated variants PTH7–84 and PTH34–84,
respectively. In total, 32 SRM transitions tuned to these six
peptides were used to monitor intact and variant forms of
PTH (Figure 1).
Generation of Standard Curves and Limits of
Detection and Quantification
rhPTH was spiked into stock human blood plasma to create
calibration curves for all target tryptic peptides through serial
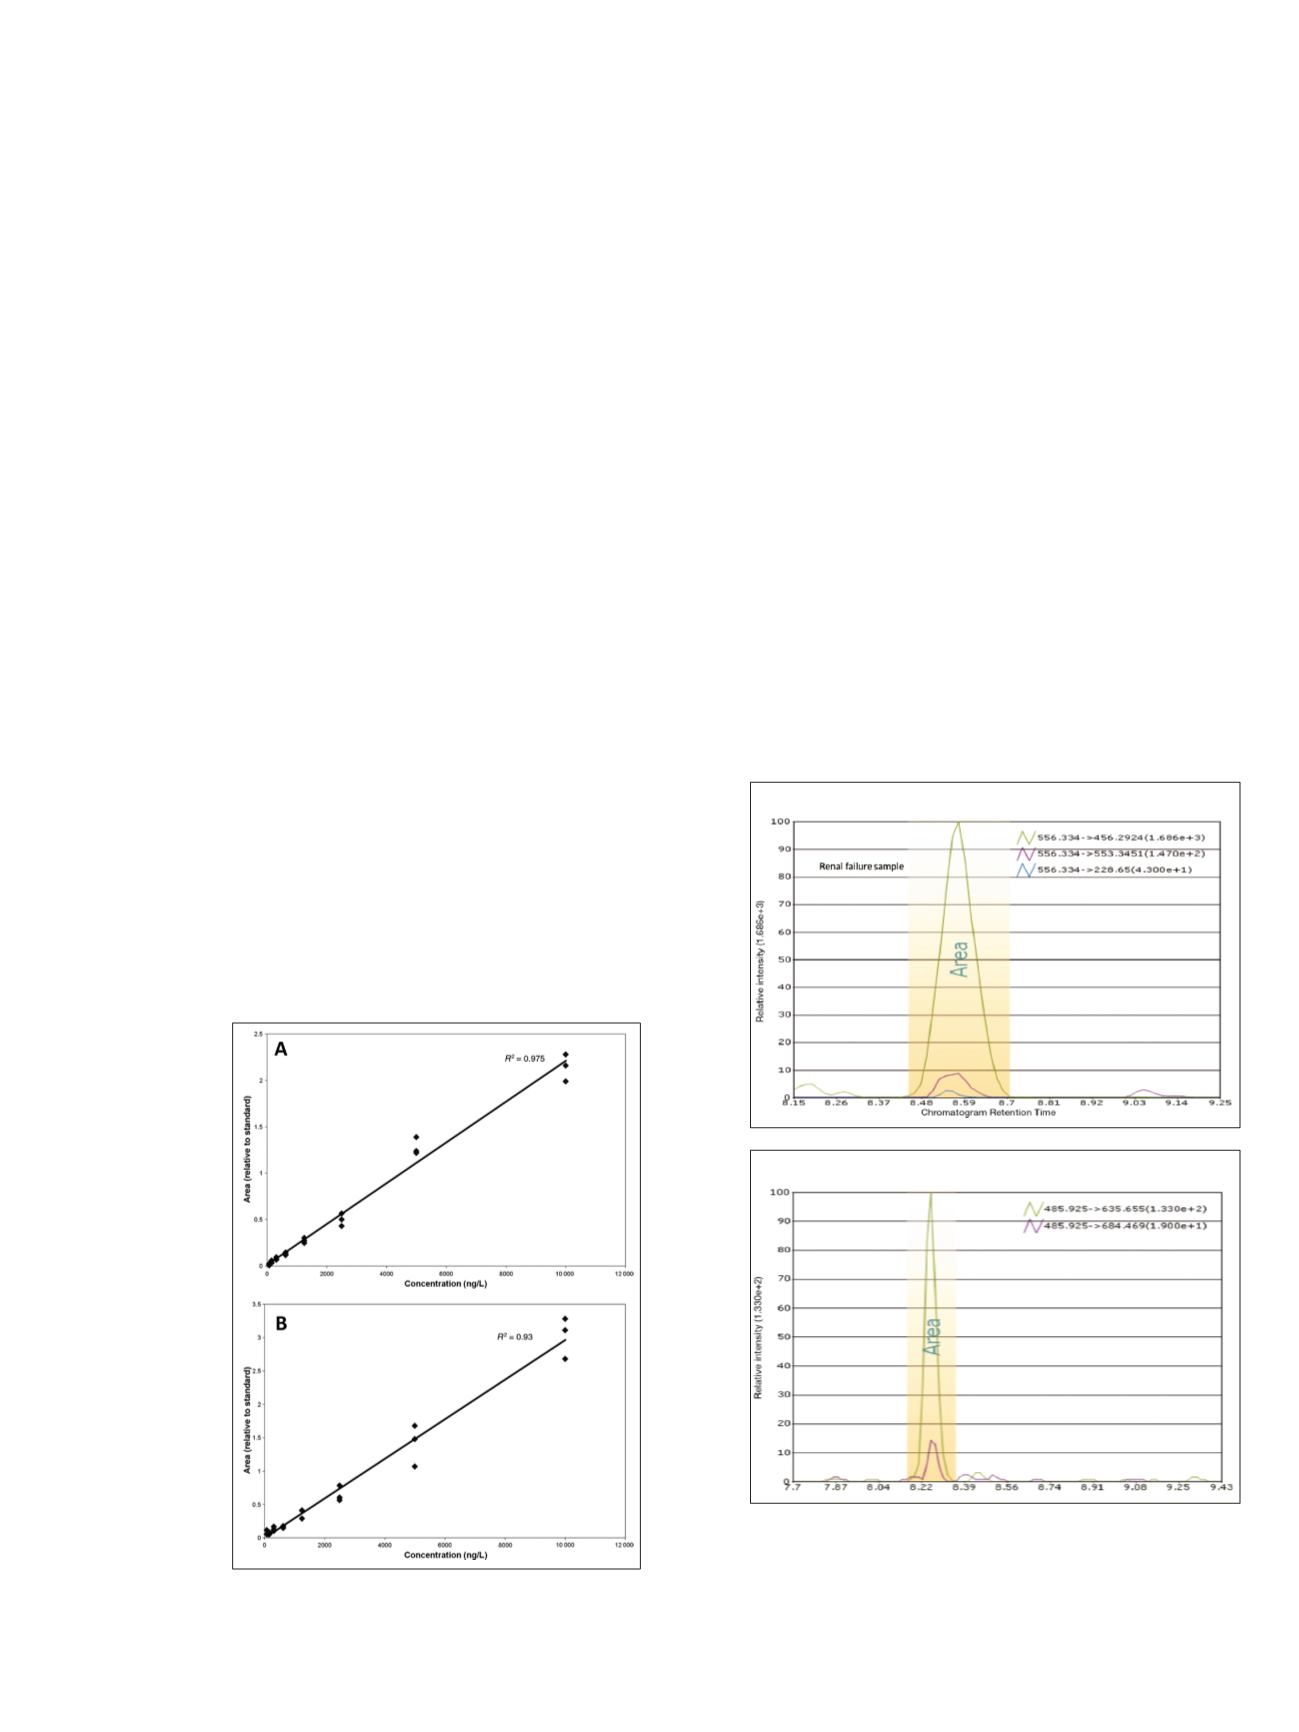
dilution. As illustrated in Figure 3 for peptides
LQDVHNFVALGAPLAPR (aa28–44) and
SVSEIQLMHNLGK (aa1–13), SRM transitions for the four
wild-type tryptic fragments exhibited linear responses
(R
2
= 0.90–0.99) relative to rhPTH concentration, with
limits of detection for intact PTH of 8 ng/L and limits of
quantification for these peptides calculated at 31 and 16 ng/L,
respectively. Standard error of analysis for all triplicate
measurements in the curves ranged from 3% to 12% for all
peptides, with <5% chromatographic drift between
replicates. In addition, all experimental peptide measurements
were calculated relative to heavy-labeled internal standards.
CVs of integrated areas under the curve for 54 separate
measurements (for each heavy peptide) ranged from 5% to
9%. Monitoring of variant SRM transitions showed no
inflections relative to rhPTH concentration, owing to the
absence of truncated variants in the stock rhPTH.
Figure 3. SRM calibration curves for PTH peptides.
(A) Peptide LQDVHNFVALGAPLAPR aa28–44.
(B) Peptide SVSEIQLMHNLGK aa1–13.
Evaluation of Research Study Samples
Initial SRM data were acquired from replicate plasma
samples. The light and heavy peptides coeluted precisely in
all samples. Further SRM experiments were carried out on
the cohort of renal failure (n = 12) and normal (n = 12)
samples. The most prominent PTH variant in the renal
failure samples was PTH34–84. To quantify this observation
with SRM, all samples were interrogated to determine the
expression ratios of renal failure to normal for the various
target peptides, including FVALGAPLAPR (aa34–84), which
should be specific to the 34–84 variant. Chromatographic
data from single renal-failure samples for peptides
FVALGAPLAPR (aa34–44) and SVSEIQLMHNLGK
(aa1–13) are shown in Figure 4. The peak integration area
and individual coeluting fragment transitions for each
peptide are illustrated. Similar chromatograms were obtained
for peptides LQDVHNFVALGAPLAPR (aa28–44),
HLNSMER (aa14–20), and ADVNVLTK (aa73–80) (data
not shown). The sample variances and expression ratios of
renal-failure samples to normal samples for each peptide are
shown in Figure 5. The expression ratios for the peptides
ranged from 4.4 for FVALGAPLAPR (aa34–44) to 12.3 for
SVSEIQLMHNLGK (aa1–13). Notable quantities of peptide
LMHNLGK (aa 7–13) were not detected in these samples.
Sample variances illustrated in the scatter plots in Figure 5
demonstrate that the renal failure and normal samples
groups were clearly segregated by the five target peptides.
Figure 4. Pinpoint software SRM data from samples of normal
and renal failure patients. Chromatographic data illustrate peak
integration area and individual fragment transitions for peptides
from single renal failure samples. (A) Semitryptic peptide
FVALGAPLAPR (aa34–44), specific to the 34–84 variant (see Figure 1).
(B) Tryptic peptide SVSEIQLMHNLGK (aa1–13).
A
B


