
3
Liquid Chromatography
Chromatographic separations were performed with a
Prelude SPLC system by direct injections onto
Thermo Scientific
™
Accucore
™
PFP 50 x 2.1 mm, 2.6 µm
analytical columns. The columns were maintained at
room temperature. Mobile phases A and B consisted of
10 mM ammonium formate with 0.1% formic acid in
water and methanol, respectively. Mobile phase usage was
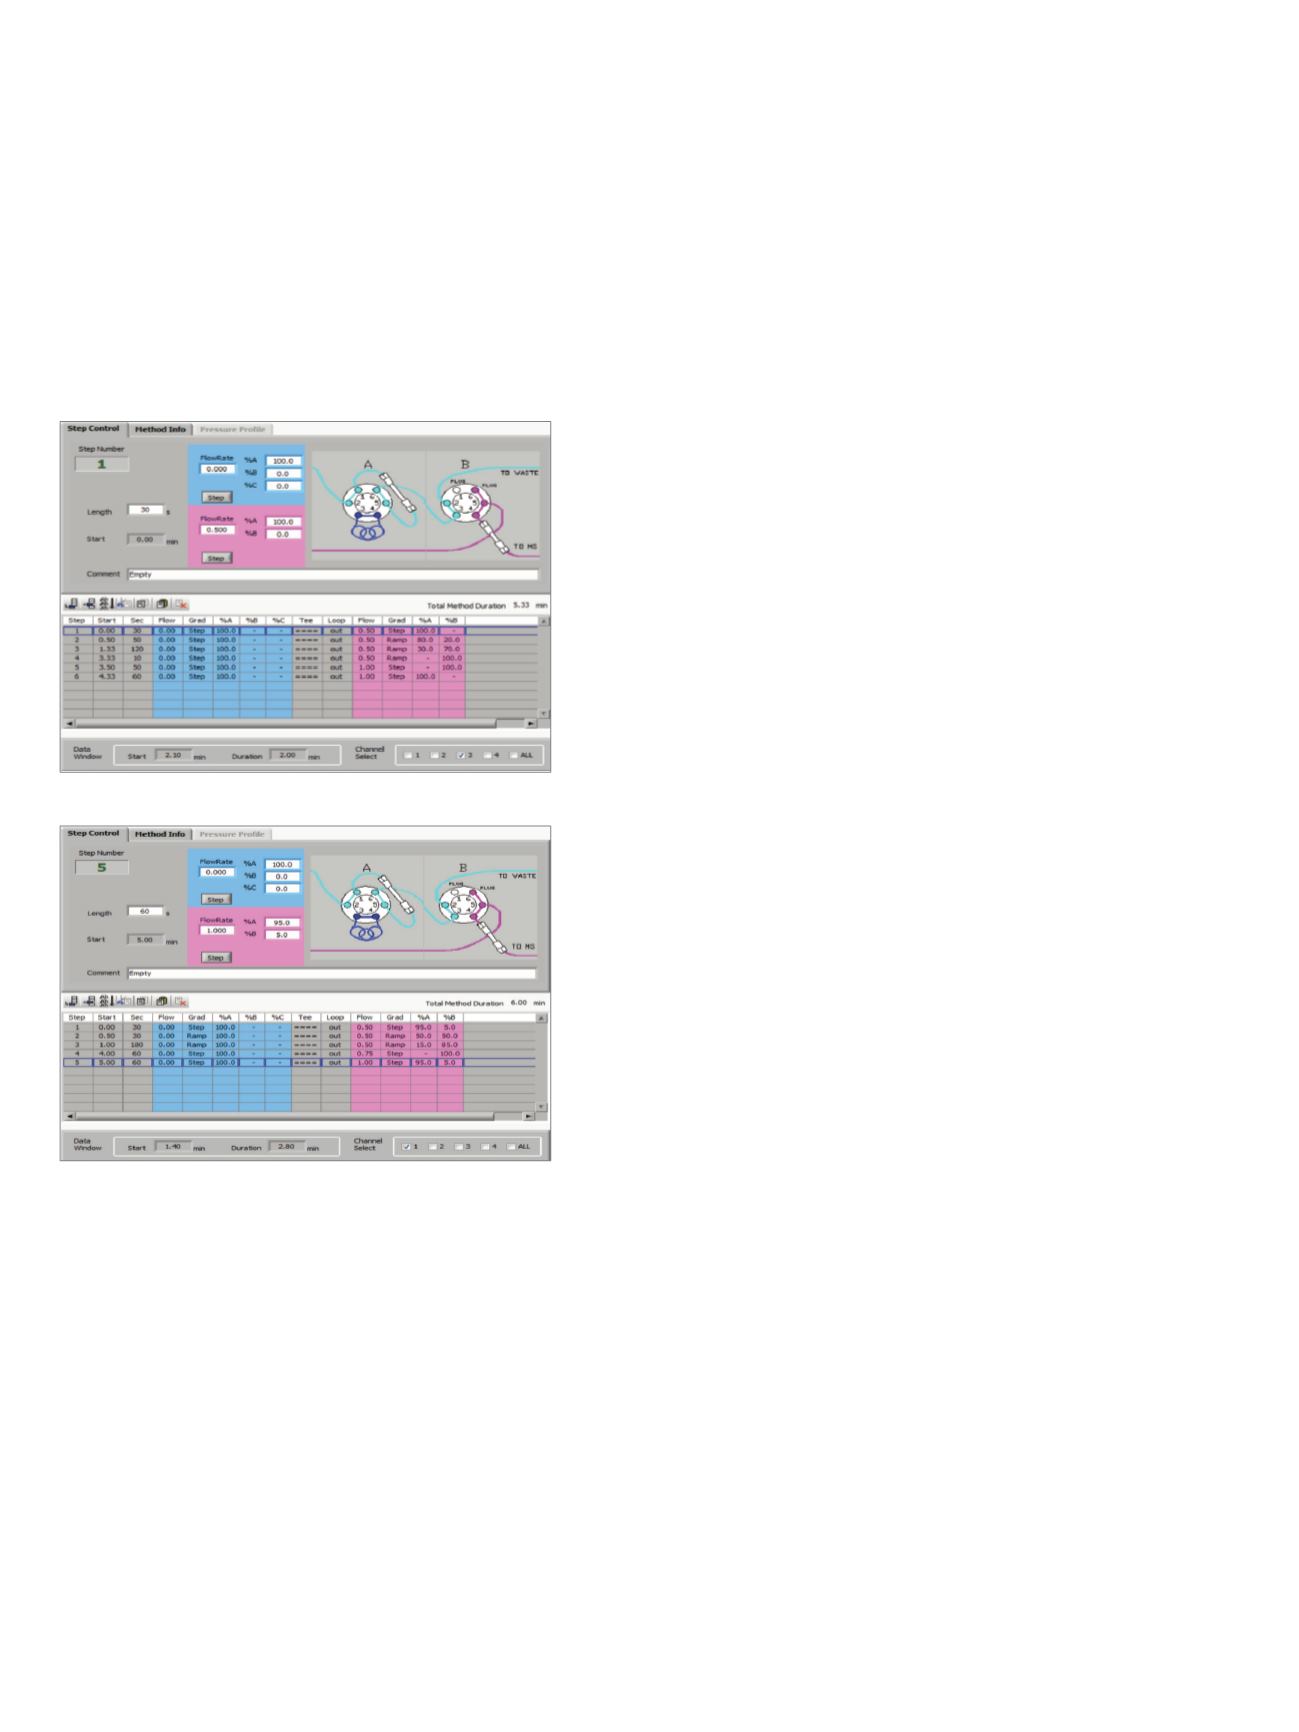
about 3.8 mL per sample. The total gradient run time was
5.3 min for opiates analysis (Figure 4) and 6 min for
benzodiazepines analysis (Figure 5). The data acquisition
windows were 2 min and 2.8 min for opiates and
benzodiazepines, respectively.
Mass Spectrometry
MS analysis was carried out on a Thermo Scientific
™
TSQ Quantum Ultra
™
triple quadrupole mass spectrometer
equipped with a heated electrospray ionization (HESI-II)
probe. The mass spectrometer was operated in selected-
reaction monitoring (SRM) mode. Two SRM transitions
were collected for each analyte and each internal standard
(Tables 1 and 2) to calculate the ion ratio.
Validation
Standard curves were prepared by fortifying pooled blank
human urine with analytes. Quality control (QC) samples
were prepared in a similar manner at concentrations
corresponding to the low (LQC), middle (MQC), and
high (HQC) ranges of the calibration curve. Intra-run
precisions were determined by processing six replicates of
each QC level along with a calibration curve on three
different days. Matrix effects were investigated by
analyzing seven donated urine samples spiked at
concentrations of 27.5 ng/mL for opiates and 50 ng/mL
for benzodiazepines. The method performance was
compared with method validated in a forensic toxicology
lab by analyzing the same donor samples. Method
validation experiments were run by executing opiates and
benzodiazepines methods in parallel on two channels in
multiplexed mode.
Figure 4. LC gradient for opiates analysis
Figure 5. LC gradient for benzodiazepines analysis


