
6
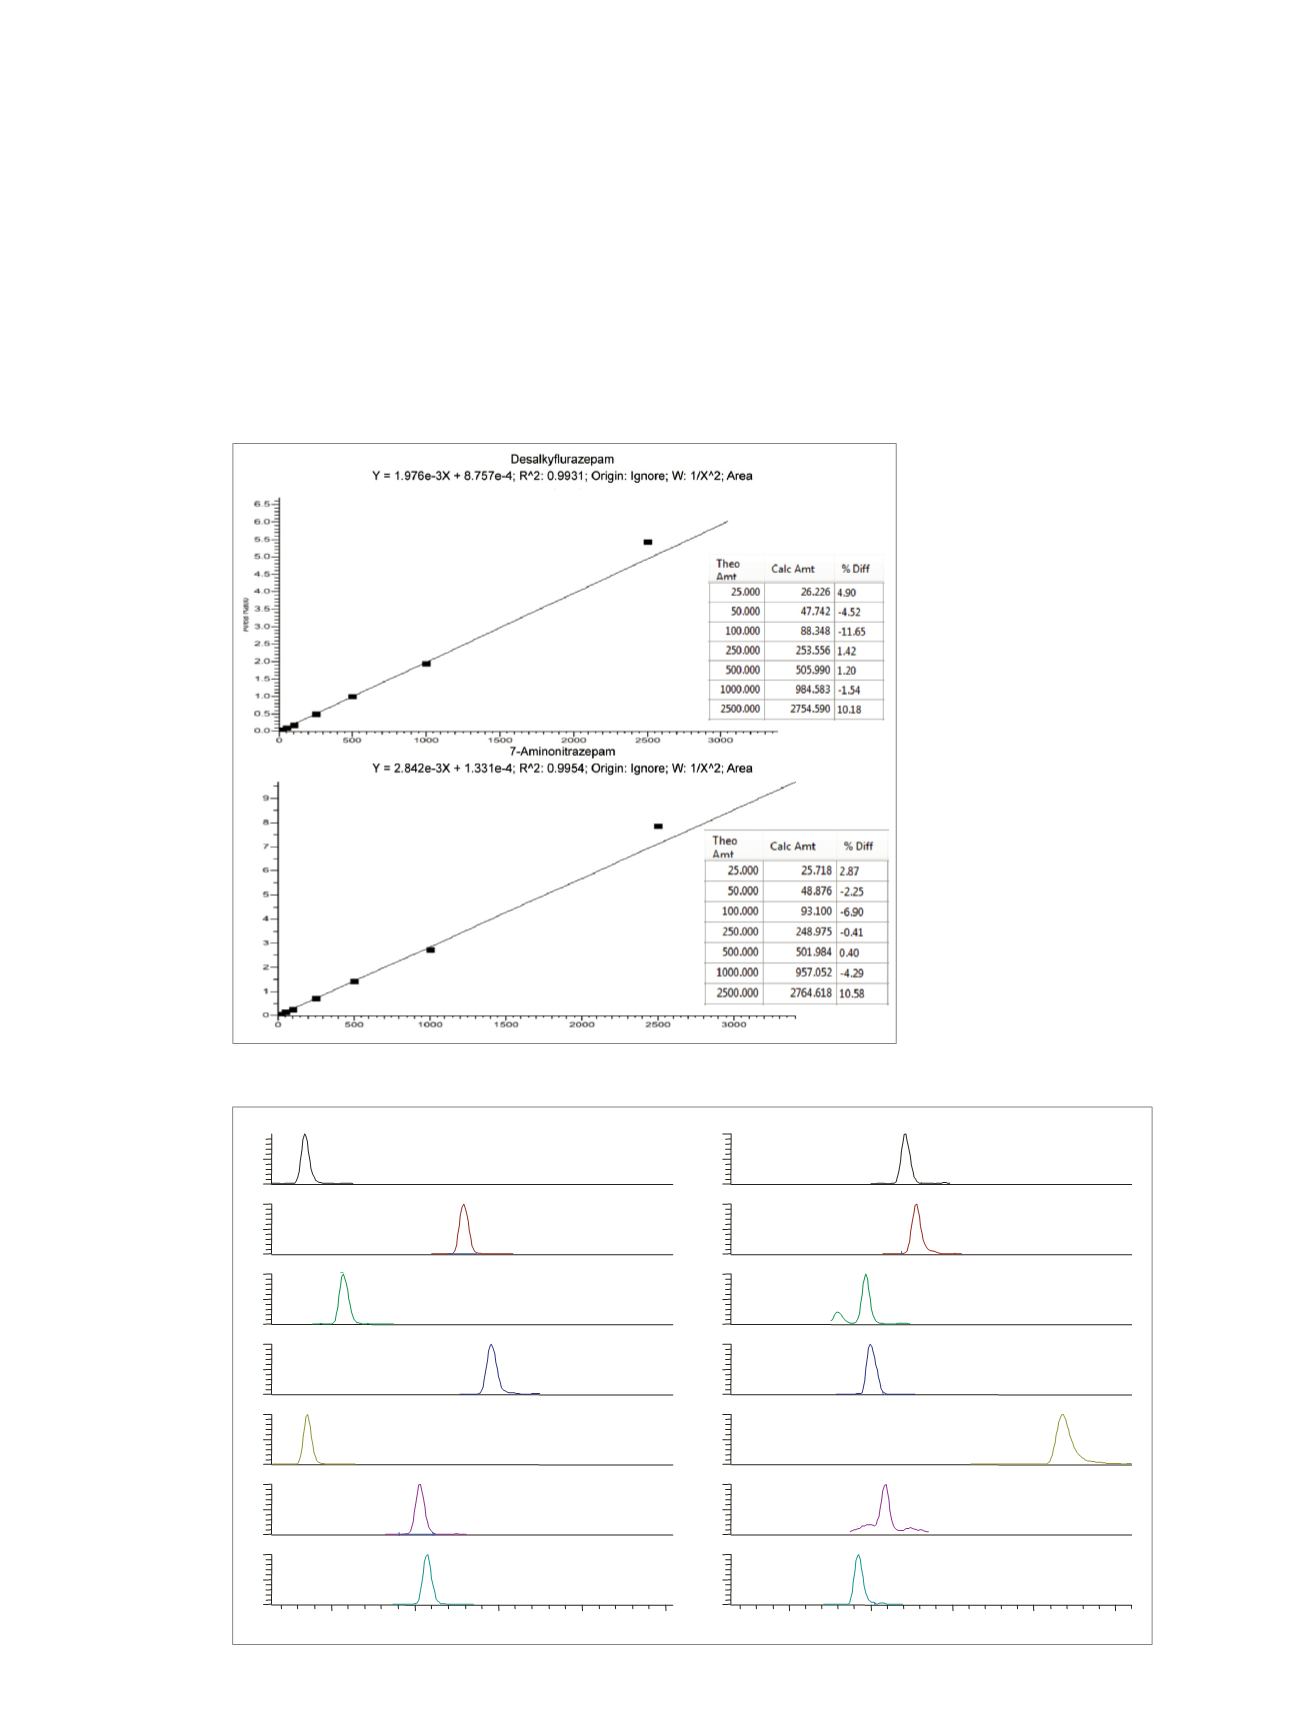
Figure 9. Calibration curves for selected benzodiazepines
0.5
1.0
1.5
2.0
2.5
Time (min)
0
50
100
0
50
100
0
50
100
0
50
100
0
50
100
0
50
100
0
50
100
0.5
1.0
1.5
2.0
2.5
Time (min)
0
50
100
0
50
100
0
50
100
0
50
100
0
50
100
0
50
100
0
50
100
Aminonitrazepam
Nordiazepam
7-Aminoflunitrazepam
Diazepam
7-Aminoclonazepam
Oxazepam
Desalkyflurazepam
Temazepam
Alprazolam
Lorazepam
α-Hydroxyalprazolam
Midazolam
2-Hydroxyethylflurazepam
Α-Hydroxytriazolam
Figure 10. Chromatogram of the lowest benzodiazepines calibration standard (10 ng/mL)
Benzodiazepines Analysis
The limits of quantitation were 25 ng/mL and calibration
ranges were 25–2000 ng/mL for all benzodiazepines.
Figure 9 shows representative calibration curves for
selected benzodiazepines. Figure 10 shows representative
chromatograms at 25 ng/mL for all benzodiazepines tested.
Intra- and inter-assay quality control statistics shown in
Table 5 demonstrate the method to be reproducible across
the calibration range for these benzodiazepines. Use of
deuterated internal standard eliminated the small matrix
effects we experienced with the method (Table 6). The data
collected with this method correlated well with data
collected using an LC/MS method previously validated in a
collaborating laboratory (Figure 11).


