
2
Experimental
The research method was applied as described in the
RECIPE ClinMass LC-MS/MS Complete Kit instructions,
with the exception of the loading flow rate, which is
described in the HPLC method.
Sample Preparation
As described in the kit instructions, 50 µL of each
calibrator and quality control was vortexed for 10 s in a
sample preparation tube with 50 µL of internal standards
solution. The sample was then centrifuged for 10 min at
10,000 rpm, and 20 µL of the supernatant was injected
into the LC-MS/MS system.
HPLC Method
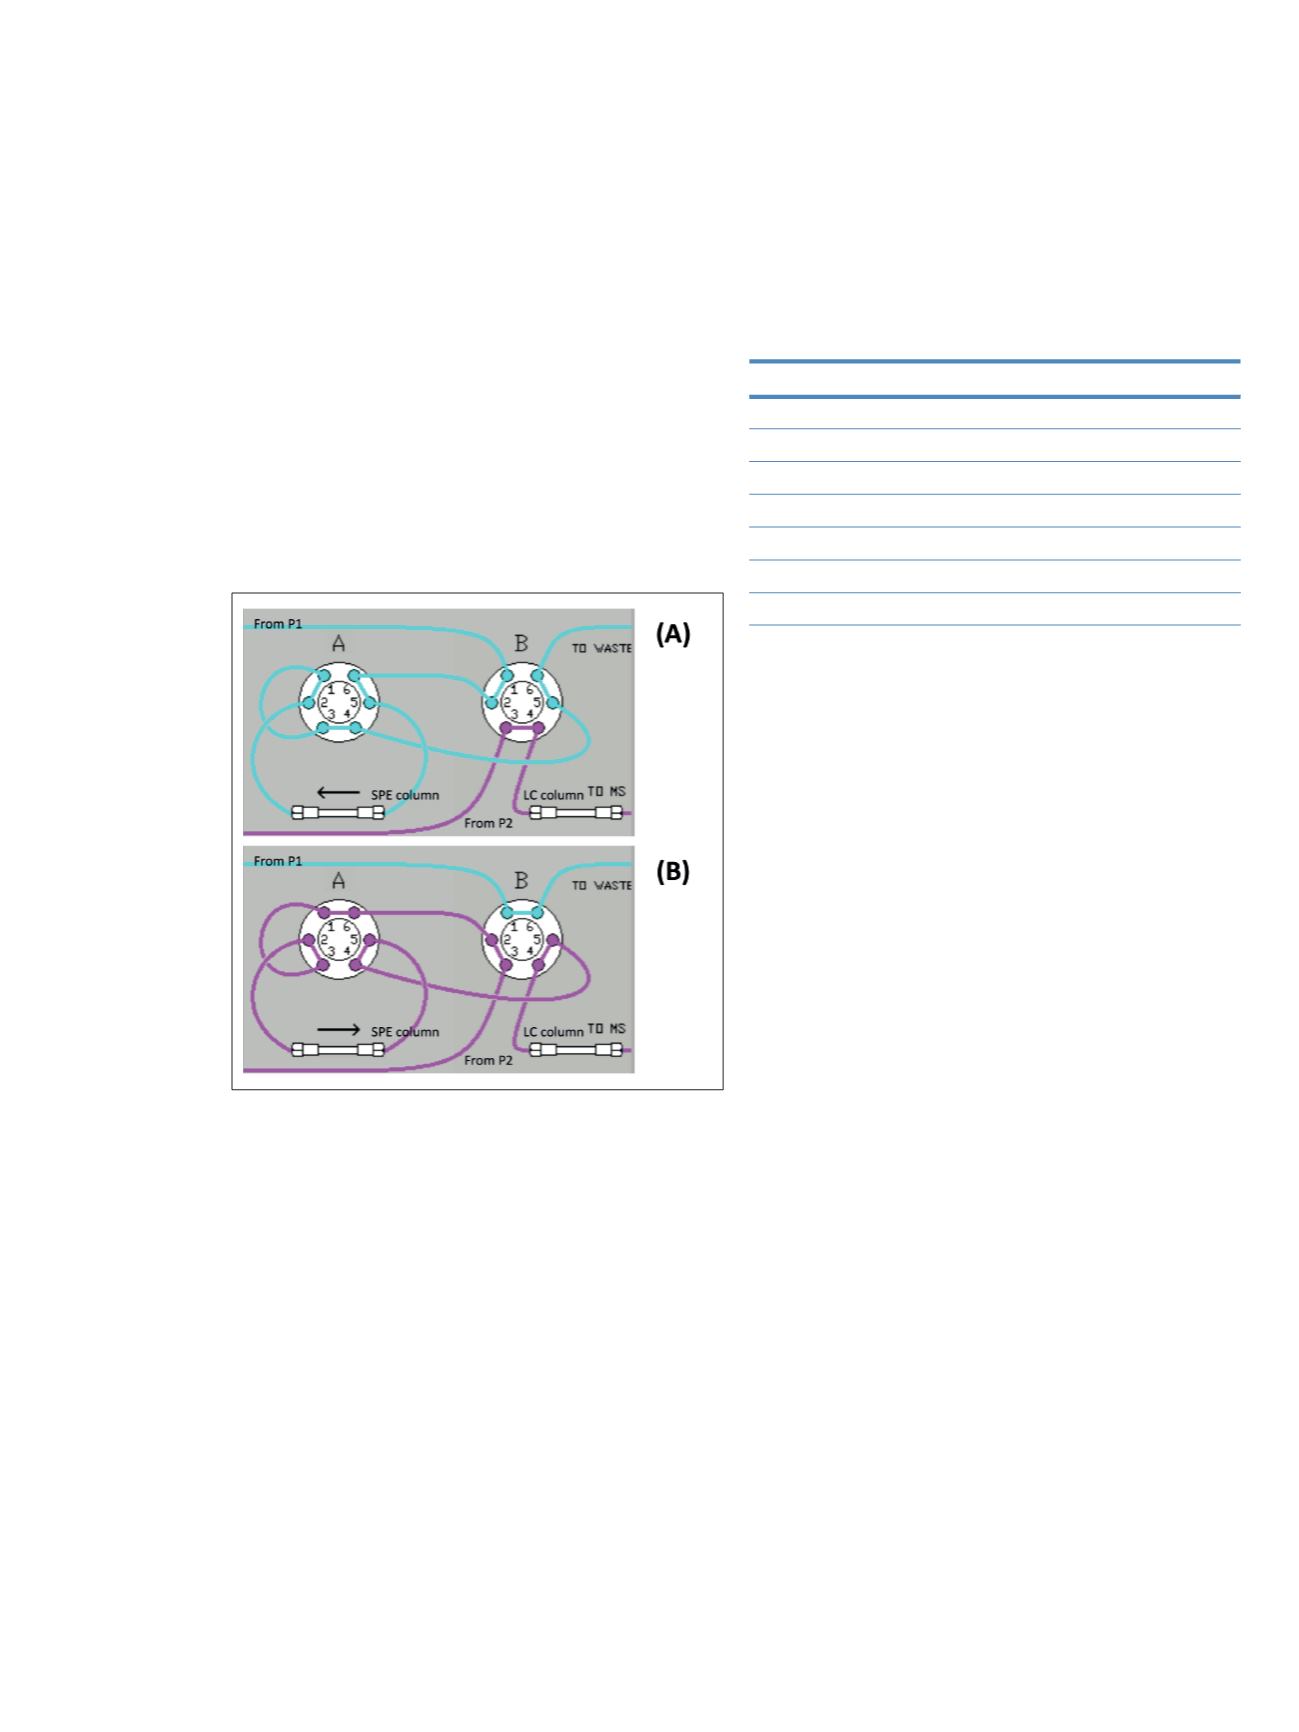
The kit includes an online solid phase extraction (SPE)
column and an HPLC separation column that are
integrated in a valve system to operate by column
switching. A Transcend TLX-1 system was used to
perform this column switching. The plumbing diagram
is shown in Figure 1.
Figure 1. Plumbing of the Transcend system to perform column
switching, with load (A) and inject (B) position, P1 is the loading
pump and P2 the elution pump
The RECIPE kit was used as described in the instructions
for this research purpose; however, the loading flow rate
was 2 mL/min instead of the 5 mL/min described in the
kit manual. This increased the time of analysis from
11 min to 12–15 min, but it did not impact the quality of
the obtained data. In the first step, the valves are in load
position (Figure 1A) where the sample is loaded onto the
SPE column for the extraction of the analytes from the
biological matrix. This step takes 1.9 min. In step two, the
valves are switched to the inject position (Figure 1B)
where the analytes extracted on the SPE column are eluted
to the HPLC column by backflushing with mobile phase
for 7.5 min. The analytes are then chromatographically
separated with a gradient. For the last step, the valves are
switched back to a loading position (Figure 1A) and both
columns are re-equilibrated for the next injection. This
step lasts 2.75 min.
MS Method
Mass spectrometric analysis was performed using a
TSQ Vantage triple-stage quadrupole mass spectrometer
equipped with an atmospheric pressure chemical ionization
(APCI) source. Source parameters are summarized in
Table 1. MS analysis was performed in positive-ion
selected-reaction monitoring (SRM) mode. The optimized
SRM parameters for all the analytes and internal standards
are presented in Table 2. The cycle time was set to 600 ms
with a data acquisition window of 4 min for each analyte.
Table 1. Optimized source parameters
Ion Source
APCI, Positive
Resolution Q1 and Q3
0.7 amu
Discharge Current
5.0 µA
Vaporizer Temperature
450 °C
Sheath Gas Pressure
30 au
Aux Gas Pressure
10 au
Capillary Temp
250 °C
Collision Pressure
1.5 mTorr
Results and Discussion
Calibration curves were plotted for each analyte with the
three calibrators provided in the kit. The regression model
for all the analytes was linear with different weighting
according to the analyte. The limits of quantification
(LOQ) were obtained by diluting the first calibrator with
blank serum either two times or five times (the blank
serum is the 0 calibrator solution). The LOQ were then
determined as the lowest concentration for which the
%RSD for 5 injections was less than 20% and the bias
was less than 20%. The weighting, internal standards,
correlation factor, and LOQ of the analytes are presented
in Table 3. Examples of chromatograms obtained at the
LOQ for some of the analyzed compounds are presented
in Figure 2. As can be seen in Table 3, good linearity was
obtained for all of the analytes in the concentration ranges
of the kit calibrators. A blank sample injected after the
upper limit of quantification (ULOQ) was used to
evaluate carryover. The carryover was less than 10% of
the signal obtained for the LOQ for all the analytes tested
with this kit.


