
3
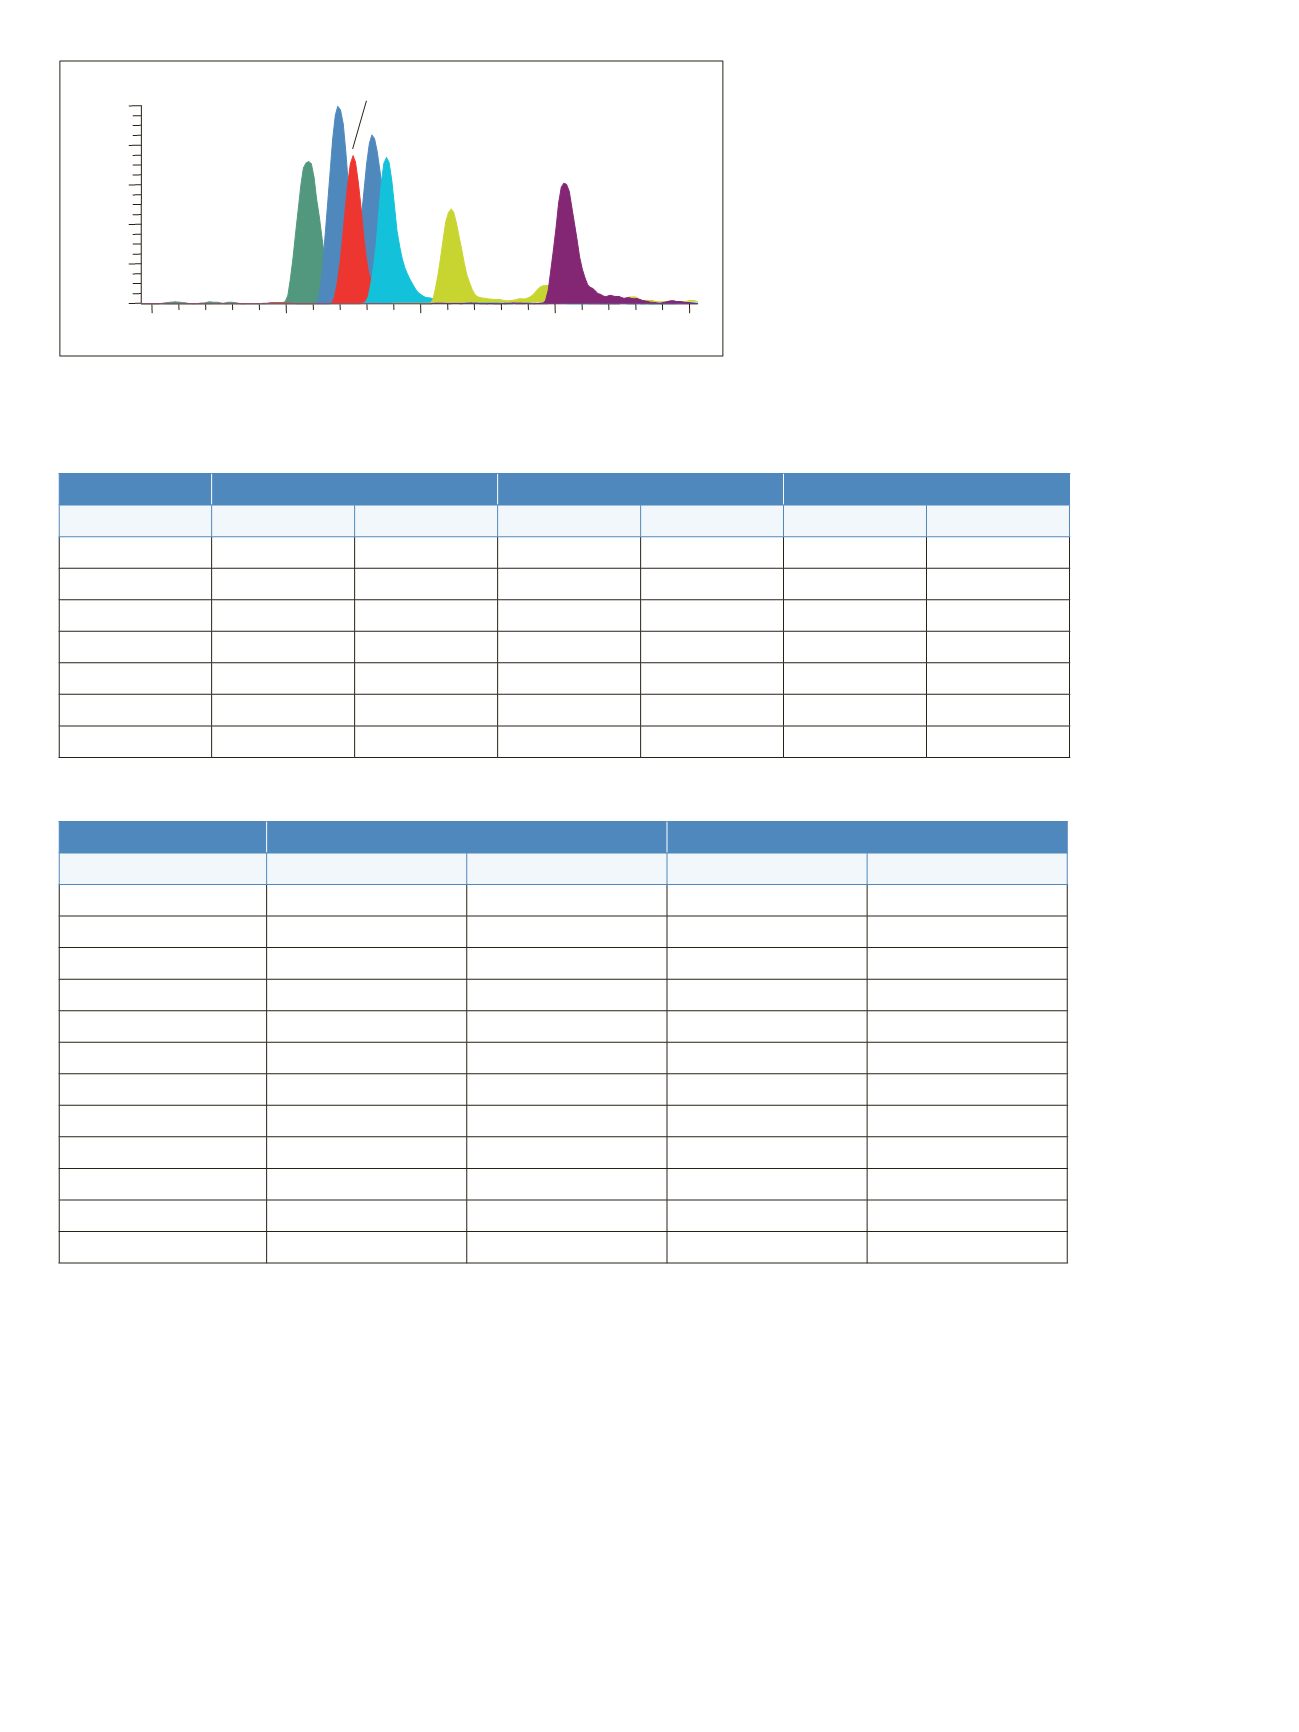
Figure 3. Representative chromatogram of cathinones at 1 ng/mL
1.0
1.5
2.0
2.5
3.0
Time (min)
0
20
40
60
80
100
Relative Abundance
Mephedrone
Methedrone
Methylone
Ethylone
Butylone
MDPV
Naphyrone
NL: 8.77E4
Table 1. Interassay QC results
LQC
MQC
HQC
n = 18
%Bias
%CV
%Bias
%CV
%Bias
%CV
butylone
-5.80%
5.13%
1.40%
4.81%
-2.86%
3.76%
ethylone
-7.36%
5.93%
6.21%
1.72%
0.777%
1.71%
MDPV
-8.32%
5.48%
5.48%
2.89%
-0.907%
2.92%
mephedrone
-3.23%
2.79%
7.89%
2.64%
0.978%
2.00%
methedrone
-0.0565%
6.21%
8.09%
2.85%
-2.44%
1.79%
methylone
-3.95%
4.86%
6.06%
2.55%
0.394%
2.07%
naphyrone
-40.2%
59.7%
-18.2%
10.9%
-10.3%
8.68%
Table 2. Average imprecision and bias across all lots of urine
Absolute Recovery
Relative Recovery
Imprecision
Bias
Imprecision
Bias
butylone
4.2%
12%
2.5%
13%
butylone-
d
3
4.0%
-1.2%
na
na
ethylone
4.8%
16%
1.9%
18%
ethylone-
d
5
4.9%
-1.5%
na
na
MDPV
3.0%
25%
1.6%
17%
MDPV-
d
8
2.9%
7.1%
na
na
mephedrone
4.7%
21%
2.2%
16%
mephedrone-
d
3
5.4%
4.3%
na
na
methedrone¹
5.4%
18%
2.7%
19%
methylone
6.3%
15%
1.4%
17%
methylone-
d
3
6.0%
-1.9%
na
na
naphyrone²
17%
49%
16%
39%
¹ Butylone-
d
3
used as IS
² MDPV-
d
8
used as IS
Although naphyrone was detected at 1 ng/mL, it showed
more variability than the other compounds and a greater
matrix effect from lot to lot. Absolute recoveries for
naphyrone ranged from 113% to 207% while relative
recoveries using MDPV-
d
8
as internal standard ranged
from 111% to 191%. All available internal standards
were tried, and MDPV-
d
8
showed the best results. A lack
of a deuterated analog for naphyrone does not allow for
matrix effect corrections and negatively affects method
precision. In this assay, naphyrone should be considered
qualitative.


