
2
Mass Spectrometry
MS analysis was carried out using a Thermo Scientific
™
TSQ Quantum Ultra
™
triple-stage quadrupole mass
spectrometer equipped with a heated electrospray
ionization (HESI-II) probe. Two selected-reaction
monitoring (SRM) transitions were monitored for each
analyte and each deuterated internal standard to provide
ion ratio confirmations (IRC). Data acquisition and
processing were performed using Thermo Scientific
™
TraceFinder
™
software.
Validation
Standard calibration curves were prepared by fortifying
pooled blank human urine with analytes. Quality control
(QC) samples were prepared in a similar manner at low
(LQC), middle (MQC), and high (HQC) concentrations.
Intrarun variability and robustness were determined by
processing six replicates of each QC level along with a
calibration curve, as outlined in the Sample Preparation
section, on three different days. Matrix effects were
investigated by comparing peak areas of analyte at 10 ng/mL
and internal standard prepared in twelve different lots of
urine to those of a sample prepared in water.
Results and Discussion
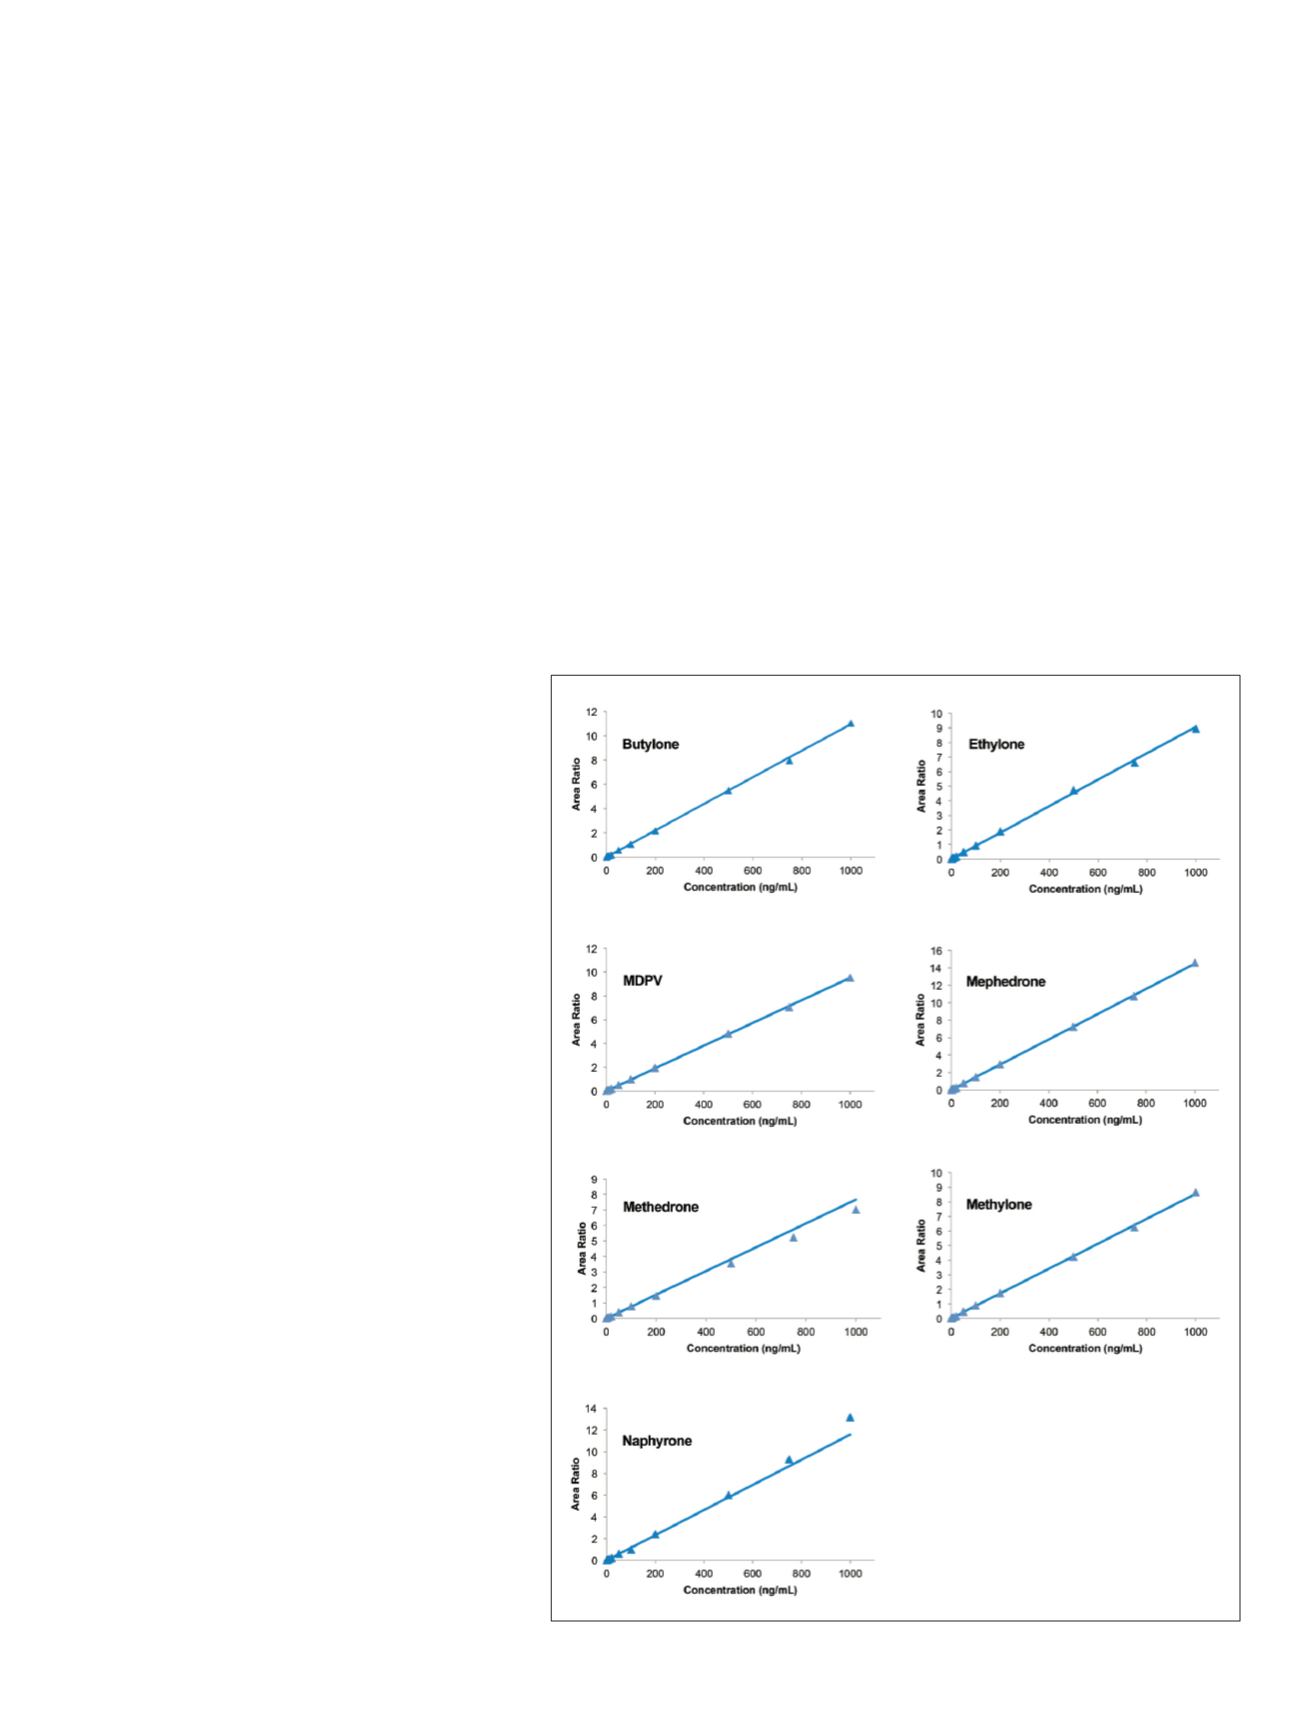
MDPV, methylone, mephedrone, methedrone, ethylone,
and butylone were all linear from 1–1000 ng/mL. Figure 2
shows representative calibration curves for all compounds
tested. Figure 3 shows representative chromatograms at
1 ng/mL for all compounds. Interassay quality control
statistics shown in Table 1 demonstrate the method to be
reproducible across the calibration range for the above
compounds. Limited matrix effects were seen for the
above compounds. These effects were largely mediated by
deuterated internal standards. The absolute recoveries of
all cathinones tested in various lots of urine, compared to
a sample prepared in water, ranged from 85% to 132%.
Relative recoveries ranged from 107% to 124%. Precision
across all lots also improved when deuterated internal
standards were used. Table 2 shows average statistics for
all lots showing improvement in both precision and
accuracy when internal standards were used.
Figure 2. Representative calibrations curves for cathinones in urine
Y = 0.01095X + 0.000238; R
2
: 0.9938; Origin: Ignore; W:1/X 2; Area
>
Y = 0.009073X + 0.002694; R
2
: 0.9989; Origin: Ignore; W:1/X; Area
Y = 0.009522X + 0.003633; R
2
: 0.9996; Origin: Ignore; W:1/X; Area
Y = 0.01449X + 0.0005551; R
2
: 0.9997; Origin: Ignore; W:1/X; Area
Y = 0.007664X + -0.0003754; R
2
: 0.9871; Origin: Ignore; W:1/X 2; Area
>
Y = 0.008538X + 0.0008878; R
2
: 0.9994; Origin: Ignore; W:1/X; Area
Y = 0.01156X + -0.001161; R
2
: 0.9894; Origin: Ignore; W:1/X 2; Area
>


