3
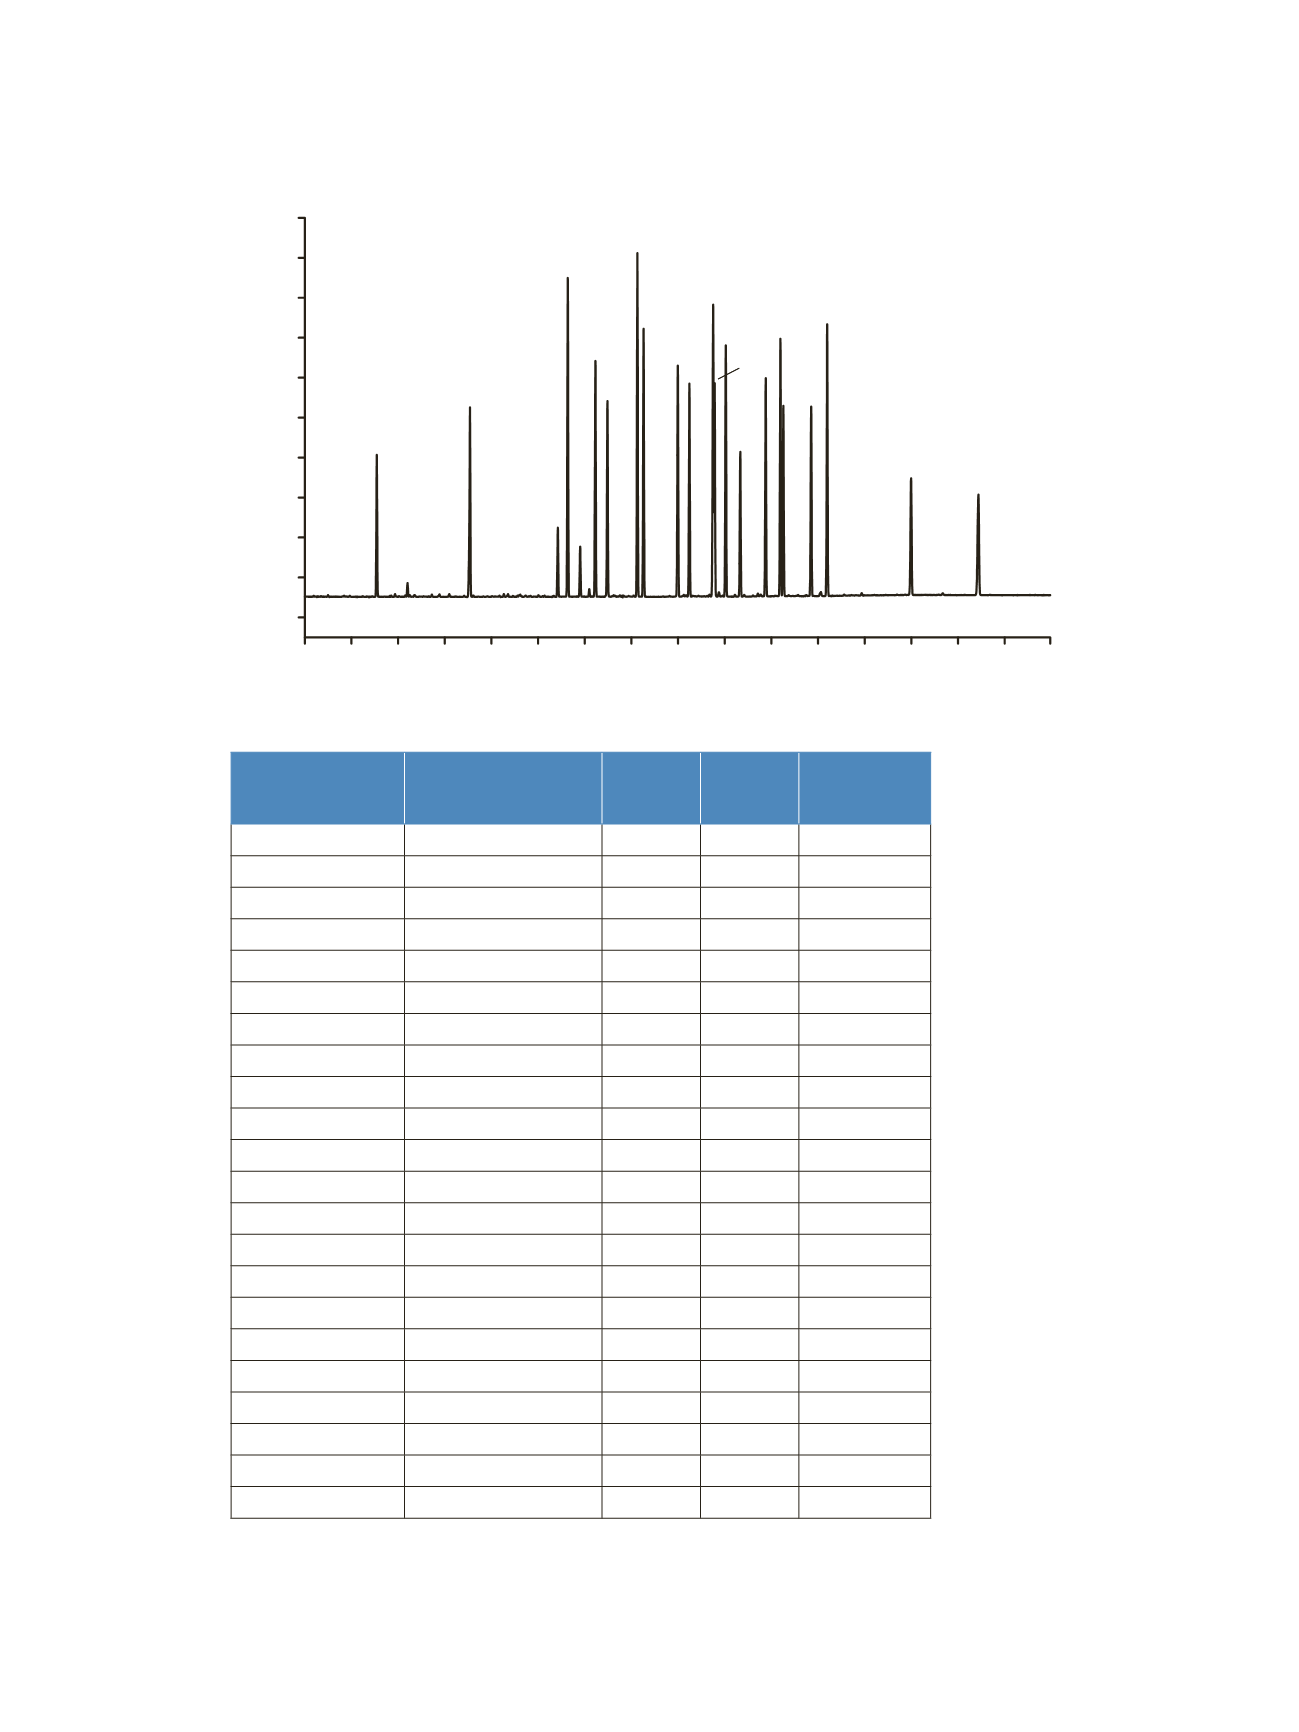
Figure 1: Chromatogram of 22 OPP standards at 20 µg/mL
mV
Minutes
10
9
0
10
20
30
40
50
60
70
80
90
100
11
12
13
14
15
16
17
18
19
20
21
22
23
24
25
1
2
3
4
5
6
7
9
8
11
10
13
14
12
16
15
20
19 18
17
22
21
Peak Number
Compound
t
R
(min)
t
R
%RSD
(n=10)
Peak Area
%RSD (n=10)
1
Dichlorvos
10.55
0.02
1.8
2
Mevinphos
12.55
0.02
2.0
3
Demeton O
14.43
0.02
2.6
4
Ethroprophos
14.65
0.01
2.0
5
Naled
14.91
0.01
2.6
6
Phorate
15.24
0.01
1.8
7
Demeton S
15.50
0.01
1.9
8
Diazinon
16.14
0.01
1.9
9
Disulfoton
16.27
0.01
1.7
10
Methyl parathion
17.01
0.01
2.2
11
Fenchlorphos
17.26
0.01
2.0
12
Fenthion
17.77
0.02
2.3
13
Chlorpyrifos
17.80
0.02
3.4
14
Trichloronate
18.04
0.01
1.9
15
Merphos
18.35
0.01
1.9
16
Stirofos
18.90
0.01
2.0
17
Tokuthion
19.21
0.02
2.1
18
Impurity
19.27
0.01
2.2
19
Fensulfothion
19.87
0.01
2.1
20
Bolstar
20.22
0.01
2.0
21
Azinphos methyl
22.02
0.01
2.3
22
Coumaphos
23.46
0.01
2.1
The tailing factors calculated according to the USP method for all peaks were 0.82–0.97 apart from
mevinphos, which gave a tailing factor of 0.77. The resolution value between peaks 17 and 18 was
1.75 according to the USP criteria. For peaks 12 and 13, the calculated resolution was 0.90.
Table 1: List of OPPs and their retention times peak area reproducibility


