3
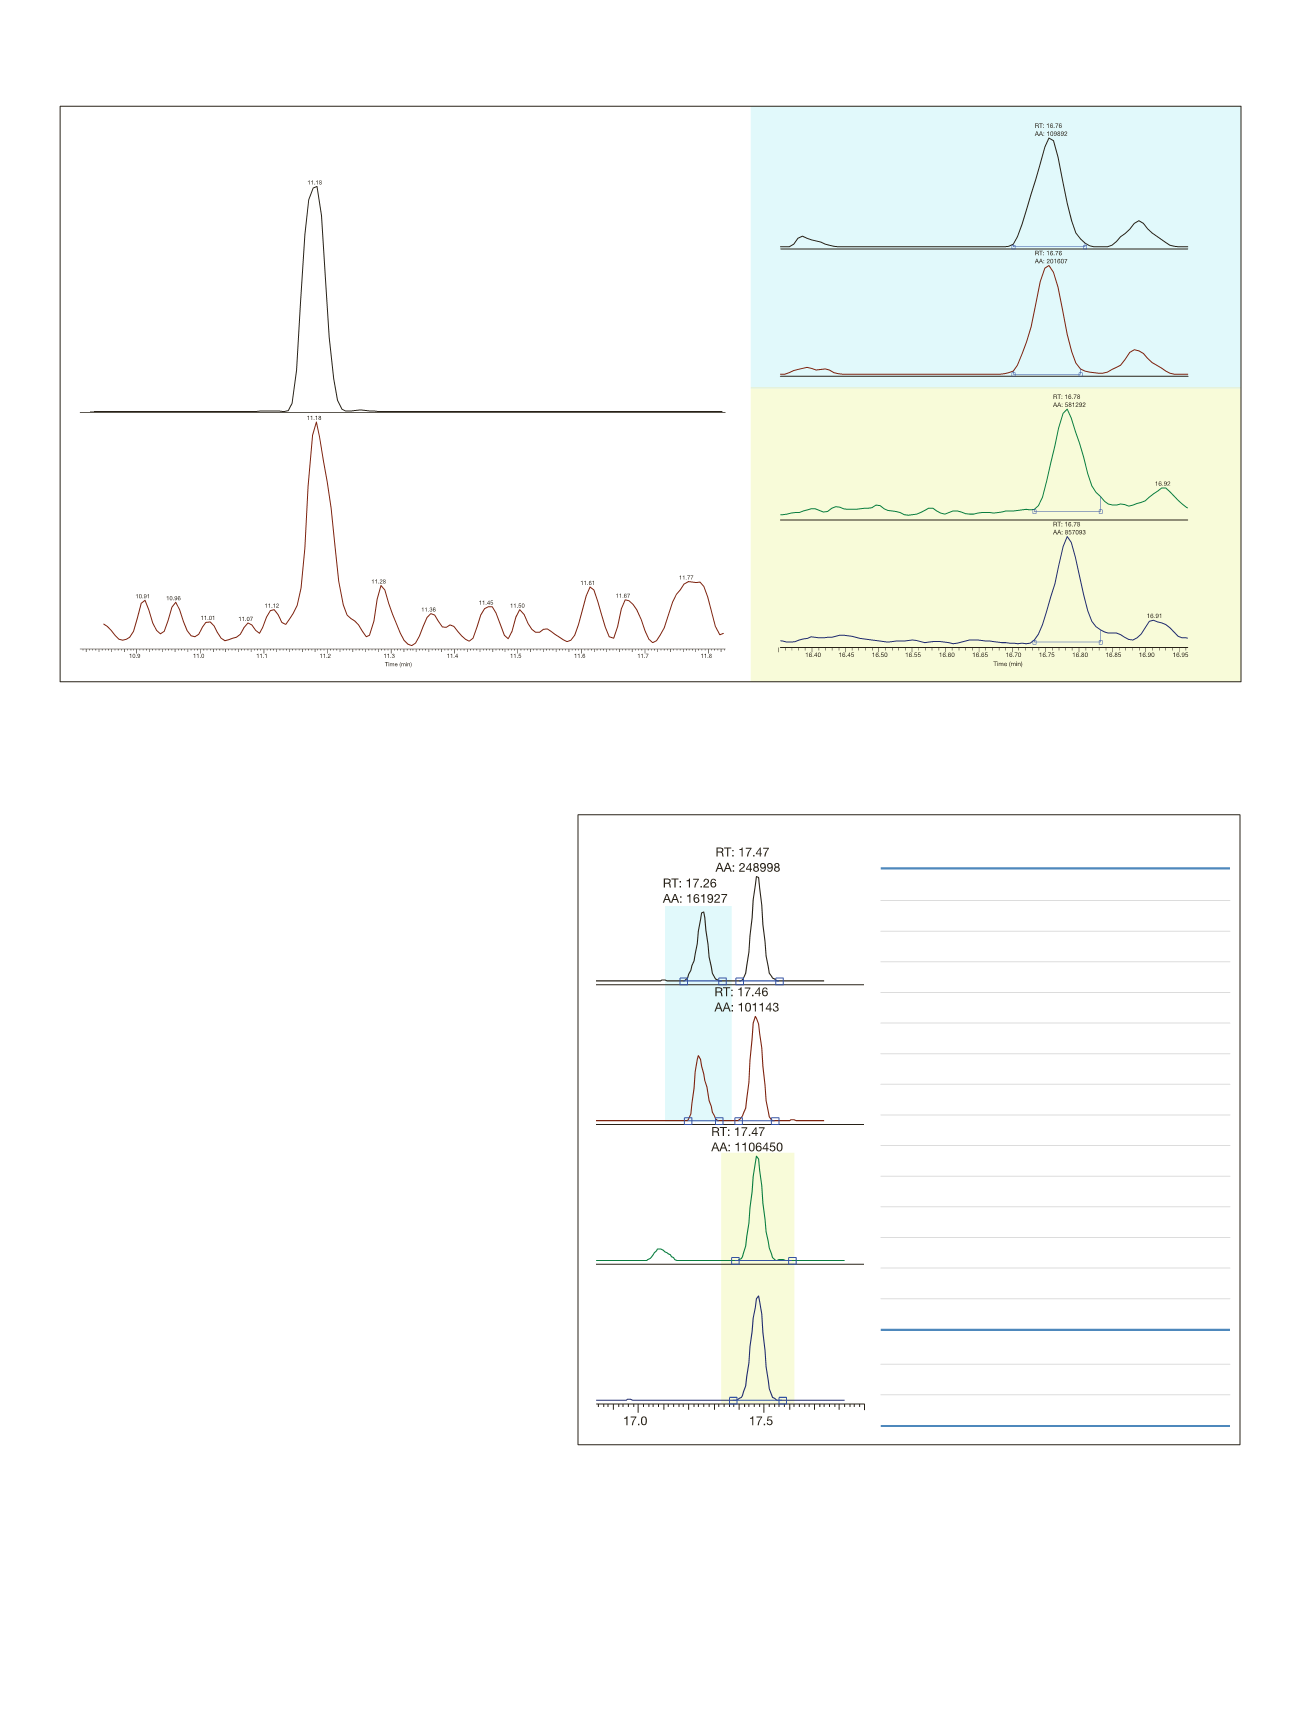
Figure 1: Comparison of U-SRM and standard SRM for pentachloroanisole and isodrin in wheat at 10 ppb levels;
Top: The chromatogram in U-SRM SRM (Q1 FWHM at 0.1 Da); Bottom: The same sample in standard mode (Q1 FWHM at 0.7 Da).
Isodrin Q1 at 0.1 Da
Isodrin Q1 at 0.7 Da
Pentachloroanisole Q1 at 0.1 Da
Pentachloroanisole Q1 at 0.7 Da
Figure 2 and Table 2: Captan (RT 17.26) and Folpet (RT 17.47) in blackcurrant extract spiked
at 10 ppb level, showing both transitions
Injections
Captan
Folpet
(10 ppb blackcurrant)
(area)
(area)
1
221347
247021
2
180365
229513
3
196336
273992
4
189745
277547
5
199317
273831
6
176386
270323
7
174745
296082
8
203117
231265
9
210897
248086
10
231017
234245
11
193543
264083
12
208722
292804
13
184633
246250
14
175942
285853
15
204764
295590
Average
196725.1
264432.3
Standard Deviation 16988.97
23534.93
RSD
8.64%
8.90%
Captan
Folpet
By increasing the mass resolution (down to 0.1 Da) of the
first quadrupole during SRM acquisitions, a more selective
isolation of the compound pre-cursor ion is achieved.
This acquisition mode is known as Ultra-Selective Reaction
Monitoring (U-SRM).
Figure 1 gives examples of U-SRM acquisition of
pentachloroanisole and isodrin at 10 ppb in wheat matrix.
Analytical Performance
The complete method validation was performed using
standard mass resolution settings at 0.7 Da.
A very comfortable detection of virtually all pesticides
was achieved at the 1 ppb level. Excellent linearity was
also observed with correlation values exceeding 0.995
for the linear calibration. In addition to this, the residual
errors for each calibration point were less than 10% for
all compounds (RSD). This included a calibration point
at the 1 ppb level.
Also, more difficult compounds such as Captan and
Folpet showed excellent peak signal and repeatability
when using this method.


