5
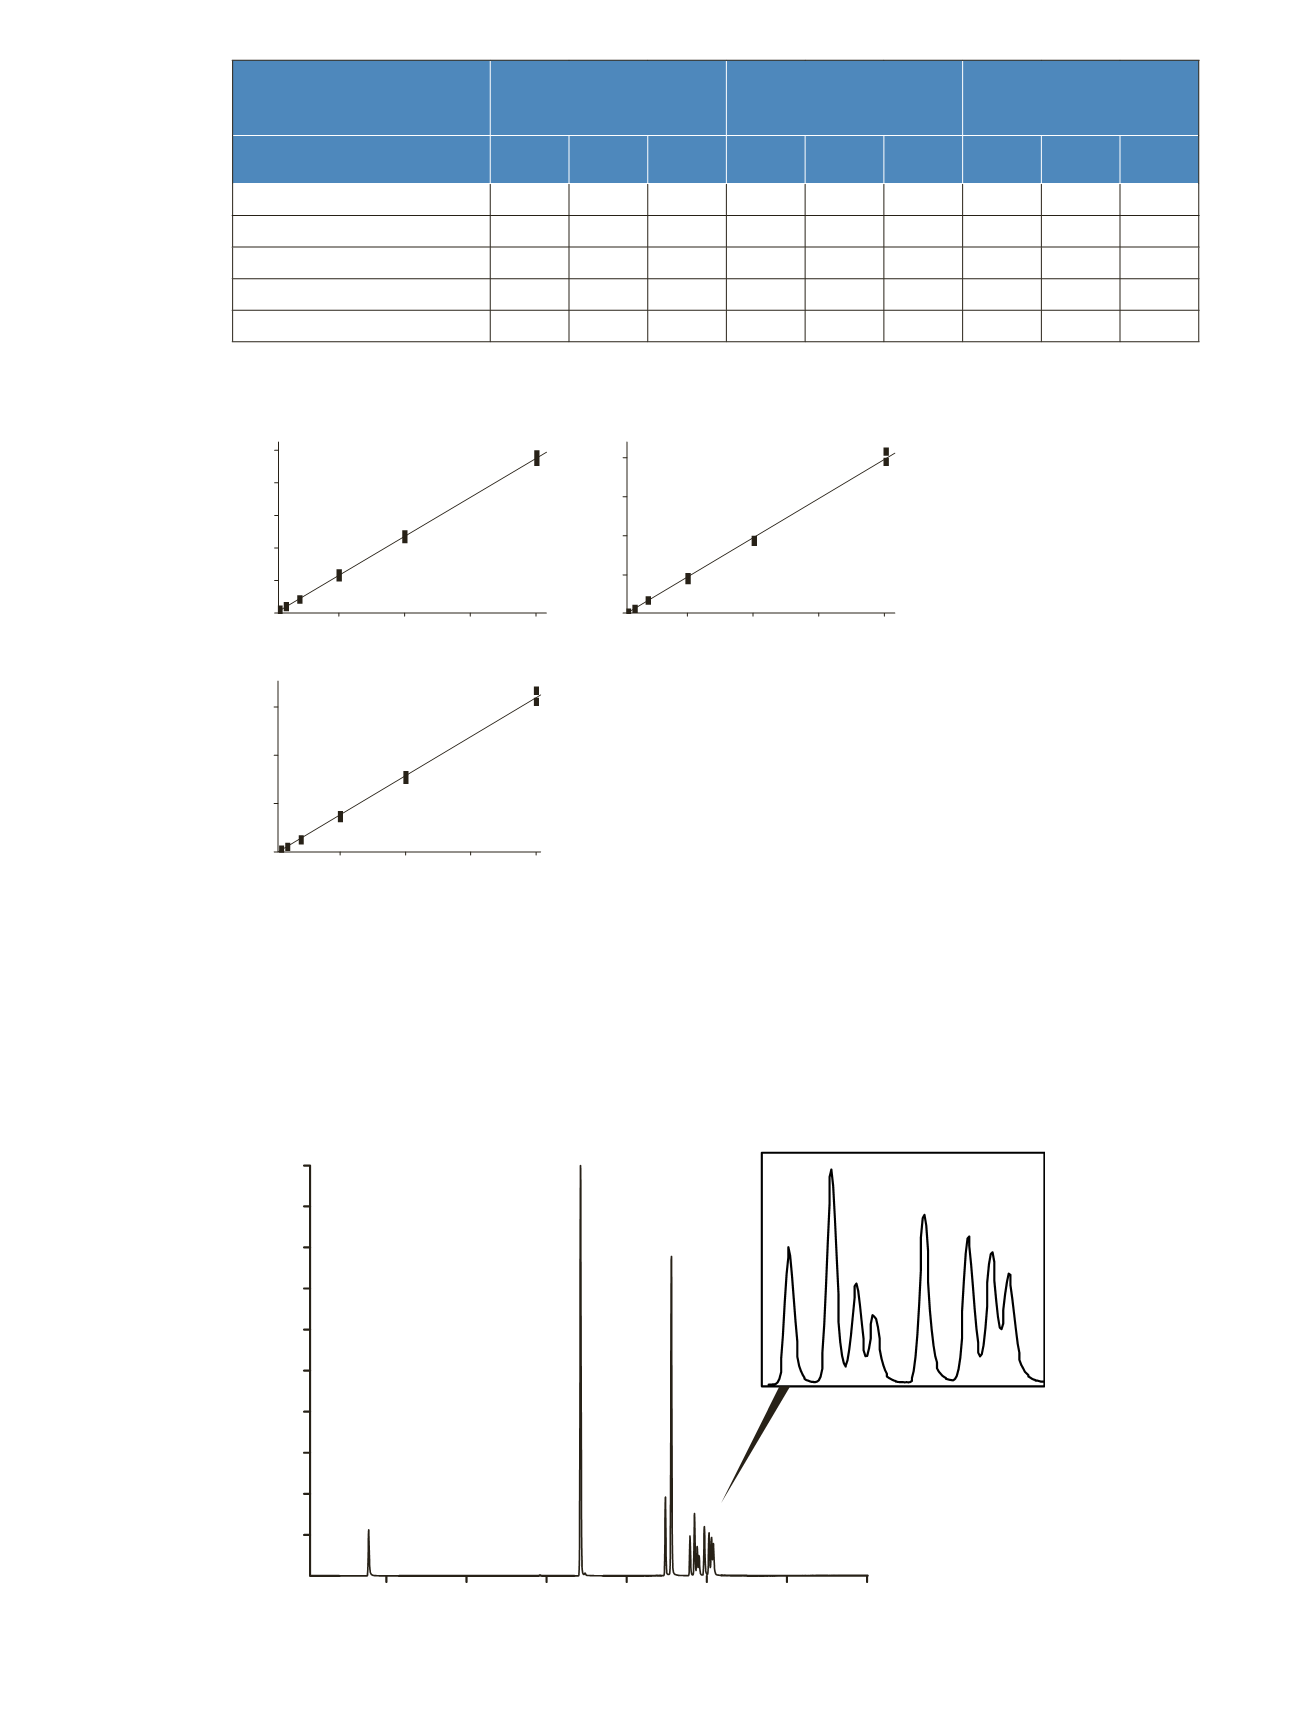
Figure 3: Calibration curves for bifenthrin and permethrin isomers (50–2000 ng/mL) using a 33 expansion high
purity clear neutral borosilicate glass vial
A calibration curve (50-2000 ng/mL) was constructed for each compound using 1,2,3,4-tetrachlo-
ronaphthalene as the internal standard (IS). The coefficients of determination (R
2
) between area
ratio of sample and internal standard for all pyrethroids were greater than 0.99 for plastic and
Target DP Total Recovery Vials, 33 expansion borosilicate clear (Type 1, Class A) (Table 2),
demonstrating good method linearity. The analysis was performed in SIM mode. Figure 4 shows
the TIC chromatogram of spiked pyrethroids in water at 0.10 ng/mL after the pre-concentration
step.
Figure 4: SIM Chromatogram of 0.10 ng/mL of pyrethroid pesticides separated on TG-5SilMS column after a
pre-concentration step using a HyperSep C18 SPE cartridge
Vials
Plastic Vial
Target DP 33 Expansion
High Purity Clear Neutral
Borosilicate Glass Vial
Non-Silanized Amber
Glass Vial
Compound
Linearity
R
2
%
Recovery
% RSD
(n=3)
Linearity
R
2
%
Recovery
% RSD
(n=3)
Linearity
R
2
%
Recovery
% RSD
(n=3)
Bifenthrin
0.9995 81.8
7.2 0.9988 101.8 4.0 0.1426 49.5
–
Permethrin Isomer a
0.9984 85.7
12.1 0.9975 117.1
4.4 0.9016 46.33
–
Permethethrin Isomer b
0.9979 85.6
5.7 0.9978 112.2 3.9 0.9296 8.08
–
Cyfluthrin Total Isomers
0.9953 101.6 6.0 0.9977 117.1
3.6 0.9967 62.61
–
Cypermethrin Total Isomers
0.9957 84.7
4.5 0.9963 113.9 4.2 0.9744 62.61
–
Table 2: Comparison data of linearity (50–2000 ng/mL) and extraction recovery for 0.10 ng/mL spiked
pyrethroids in water using plastic, 33 expansion high purity clear neutral borosilicate glass, and non-silanized
amber vials.
Area Ratio
500
0
2
4
6
8
10
1000
1500
2000
ng/mL
Area Ratio
500
0.0
0.5
1.0
1.5
2.0
1000
1500
2000
ng/mL
Area Ratio
500
0
2
4
6
1000
1500
2000
ng/mL
Bifenthrin
Permethrin Isomer A
Permethrin Isomer B
Relative Abundance
Time (min)
8
10
0
20
30
40
50
60
70
80
90
100
10
12
14
16
18
20
1
2
3
4
5-8
9-12
5
6
7
8
9
10
11
12


