 
          AN20549_E 07/12S
        
        
          Application Note 20549
        
        
          thermoscientific.com/tracegold
        
        
          © 2012 Thermo Fisher Scientific Inc. All rights reserved. All trademarks are the property of Thermo Fisher Scientific Inc. and its subsidiaries.
        
        
          Specifications, terms and pricing are subject to change. Not all products are available in all countries. Please consult your local sales representative for details.
        
        
          Relative Abundance
        
        
          Time (min)
        
        
          5
        
        
          0
        
        
          10
        
        
          15
        
        
          20
        
        
          25
        
        
          30
        
        
          35
        
        
          40
        
        
          45
        
        
          50
        
        
          55
        
        
          60
        
        
          65
        
        
          70
        
        
          75
        
        
          80
        
        
          85
        
        
          90
        
        
          95
        
        
          100
        
        
          6
        
        
          8 10 12 14 16 18 20 22 24 26
        
        
          1
        
        
          2
        
        
          3
        
        
          4
        
        
          5
        
        
          6
        
        
          7
        
        
          8 9
        
        
          10
        
        
          11
        
        
          12
        
        
          13
        
        
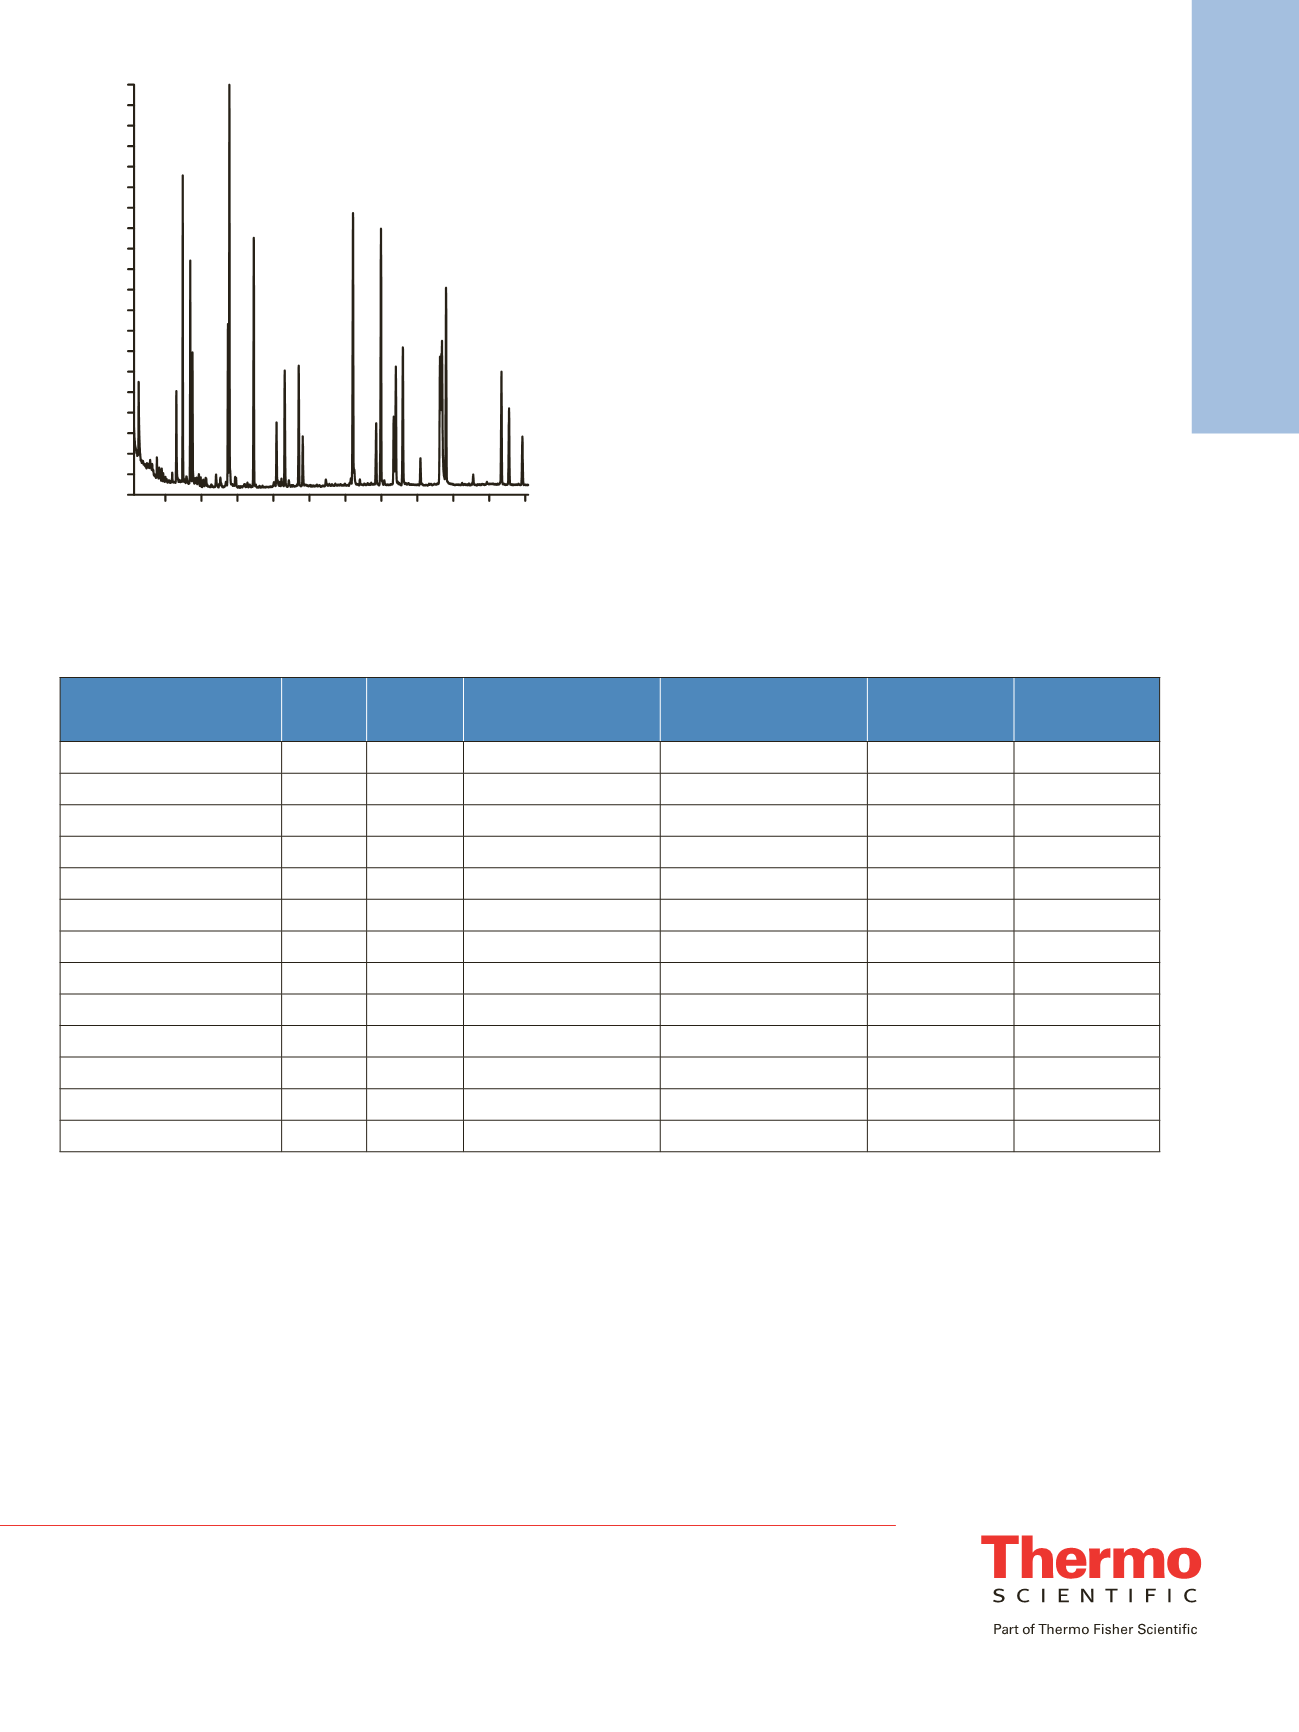
          Figure 2: TIC for the GC/MS analysis of cucumber matrix spiked
        
        
          with 10 µg/g of each pesticide in full scan (50-450 m/z).
        
        
          See Table 2 for identified peaks. Unidentified peaks are matrix
        
        
          peaks
        
        
          USA and Canada
        
        
          +1 800 332 3331
        
        
          France
        
        
          +33 (0)1 60 92 48 34
        
        
          Germany
        
        
          +49 (0) 2423 9431 20 or 21
        
        
          United Kingdom
        
        
          +44 (0)1928 534110
        
        
          Japan
        
        
          +81 3 5826 1615
        
        
          China
        
        
          +86 21 68654588 +86 10 84193588
        
        
          +86 20 83145199     800 810 5118
        
        
          India
        
        
          +91 22 6742 9494 +91 27 1766 2352
        
        
          Australia
        
        
          1 300 735 292 (free call domestic)
        
        
          New Zealand
        
        
          0800 933 966 (free call domestic)
        
        
          All Other Enquiries
        
        
          +44 (0) 1928 534 050
        
        
          Technical Support
        
        
          North America
        
        
          +1 800 332 3331
        
        
          Outside North America
        
        
          +44 (0) 1928 534 440
        
        
          Conclusion
        
        
          The QuEChERS sample preparation method provided
        
        
          high recoveries and good reproducibility. The QuEChERS
        
        
          – GC/MS method was found to be linear in the
        
        
          concentration range of 25 to 1000 ng/g spiked matrix.
        
        
          The TraceGOLD TG-5MS GC column provided good
        
        
          chromatographic resolution of the pesticides studied.
        
        
          References
        
        
          1. M. Anastassiades, S.J. Lehotay, D. Stajnbaher and F.J.
        
        
          Schenck, J AOAC Int 86 (2003) 412.
        
        
          2. Foods of plant origin - Determination of pesticide
        
        
          residues using GC/MS and/or LC-MS/MS following
        
        
          acetonitrile extraction/partitioning and clean-up by
        
        
          dispersive SPE –QuEChERS method. European Standard
        
        
          EN15662:2008
        
        
          Pesticides
        
        
          t
        
        
          R
        
        
          (min) Linearity Nominal concentration
        
        
          ng/g
        
        
          Measured concentration
        
        
          (n=6) ng/g.
        
        
          Average %
        
        
          Recovery (n=6)
        
        
          Recovery
        
        
          %RSD (n=6)
        
        
          1. Dichlobenil
        
        
          4.52
        
        
          0.9988
        
        
          50
        
        
          58.7
        
        
          117.4
        
        
          2.1
        
        
          2. Tribromoanisol
        
        
          6.60
        
        
          0.9990
        
        
          50
        
        
          54.3
        
        
          108.5
        
        
          6.0
        
        
          3. Sulfotep
        
        
          6.95
        
        
          0.9984
        
        
          50
        
        
          59.8
        
        
          119.6
        
        
          2.3
        
        
          4. Hexachlorobenzene
        
        
          7.49
        
        
          0.9983
        
        
          50
        
        
          55.2
        
        
          110.4
        
        
          2.8
        
        
          5. Parathion
        
        
          10.90 0.9979
        
        
          50
        
        
          53.0
        
        
          106.0
        
        
          5.9
        
        
          6. Triphenylphosphine (IS)
        
        
          13.41
        
        
          -
        
        
          -
        
        
          -
        
        
          -
        
        
          -
        
        
          7. EPN
        
        
          17.90 0.9985
        
        
          50
        
        
          46.1
        
        
          92.1
        
        
          6.7
        
        
          8. Azinphos methyl
        
        
          19.20 0.9984
        
        
          50
        
        
          37.6
        
        
          75.2
        
        
          4.9
        
        
          9. Permethrin isomer a
        
        
          21.38 0.9987
        
        
          50
        
        
          49.8
        
        
          99.5
        
        
          8.9
        
        
          10. Permethrin isomer b
        
        
          21.58 0.9985
        
        
          50
        
        
          50.9
        
        
          101.9
        
        
          4.8
        
        
          11. Fenvalerate isomer a
        
        
          24.60 0.9985
        
        
          50
        
        
          47.7
        
        
          95.4
        
        
          8.9
        
        
          12. Fenvalerate isomer b
        
        
          25.02 0.9973
        
        
          50
        
        
          50.6
        
        
          101.2
        
        
          7.2
        
        
          13. Deltamethrin
        
        
          25.84 0.9949
        
        
          50
        
        
          51.7
        
        
          103.3
        
        
          6.8
        
        
          Table 2: Summary of Results
        
        
          Unidentified peaks in Figure 2 are impurity/matrix peaks