3
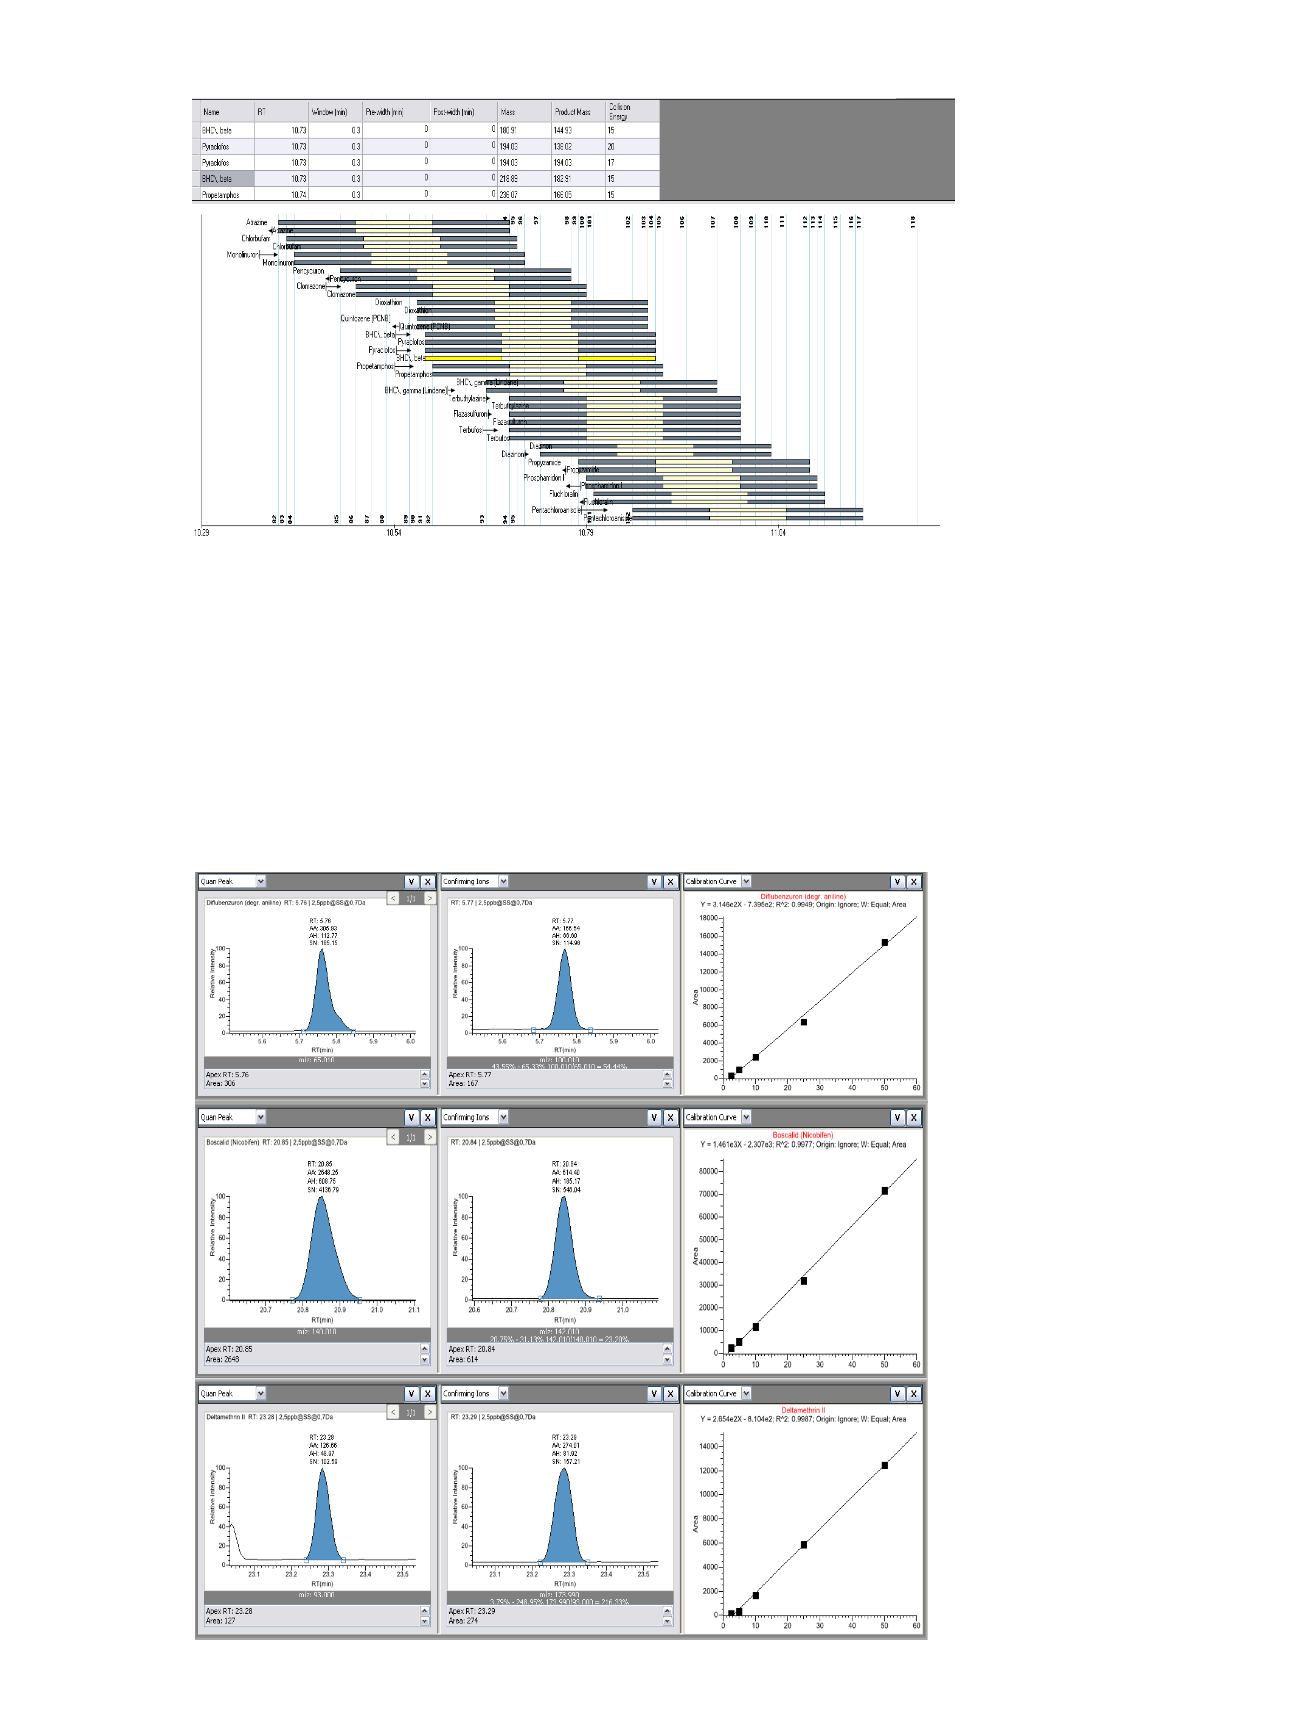
FIGURE 2. Principle of the timed-SRM acquisition setup of the TSQ 8000. The white center parts show the peak width centered to the compound retention time,
the grey areas before and after the peak the full SRM acquisition window of 0.3 min.
Number of target compound in method
Retention time [min]
Results
The multi-residue pesticide analysis of Ayurvedic churnas
for routine target analytes detection and quantitationis
described using liquid-liquid extraction and GC-MS/MS
detection with the TSQ 8000 GC-MS/MS system.
All standards and samples were processed using
TraceFinder software with high speed and throughput.
All compounds included into this method had very good
calibration correlation coefficients of > 0.99 for the
concentration range of 2.5 to 50 ng/g, as shown Figure 3.
The obtained recoveries were high within 70-120% with
< 20% associated RSDs.
FIGURE 3. Selected pesticide chromatograms at 2.5 ng/g and their calibration curves.


