3
Calibration and Linearity
The quantitative calibration and linearity check for the
method was performed by using six calibration points in
the range of 0.004 µg/mL to 1.0 µg/mL. This range
represents an analyte concentration of 0.01 to 2.5 mg/kg
in the samples (10 – 2500 ppb).
For setting up the calibration solutions, a stock solution
containing target pesticide compounds in herbal products
was used. The calibration solution was prepared in a
standard matrix with a matrix load equivalent to the
typical herbal extracts used. The standard matrix blank
consisted of lemon peel extracted using the standard
procedure. The pesticide blank level was tested before
applying as a blank standard matrix. Standard solutions
were prepared containing lemon peel extract dissolved 1:1
with ethyl acetate. The correlation coefficients, R
2
,
achieved during method calibration exceeded 0.99 for all
compounds (Figure 2).
Figure 2. Calibration curve for Cyfluthrin, R
2
= 0.9996
Results and Discussion
Sensitivity (LOD)
Using the standard pool of pesticides, the method
detection limits in the standard lemon peel were
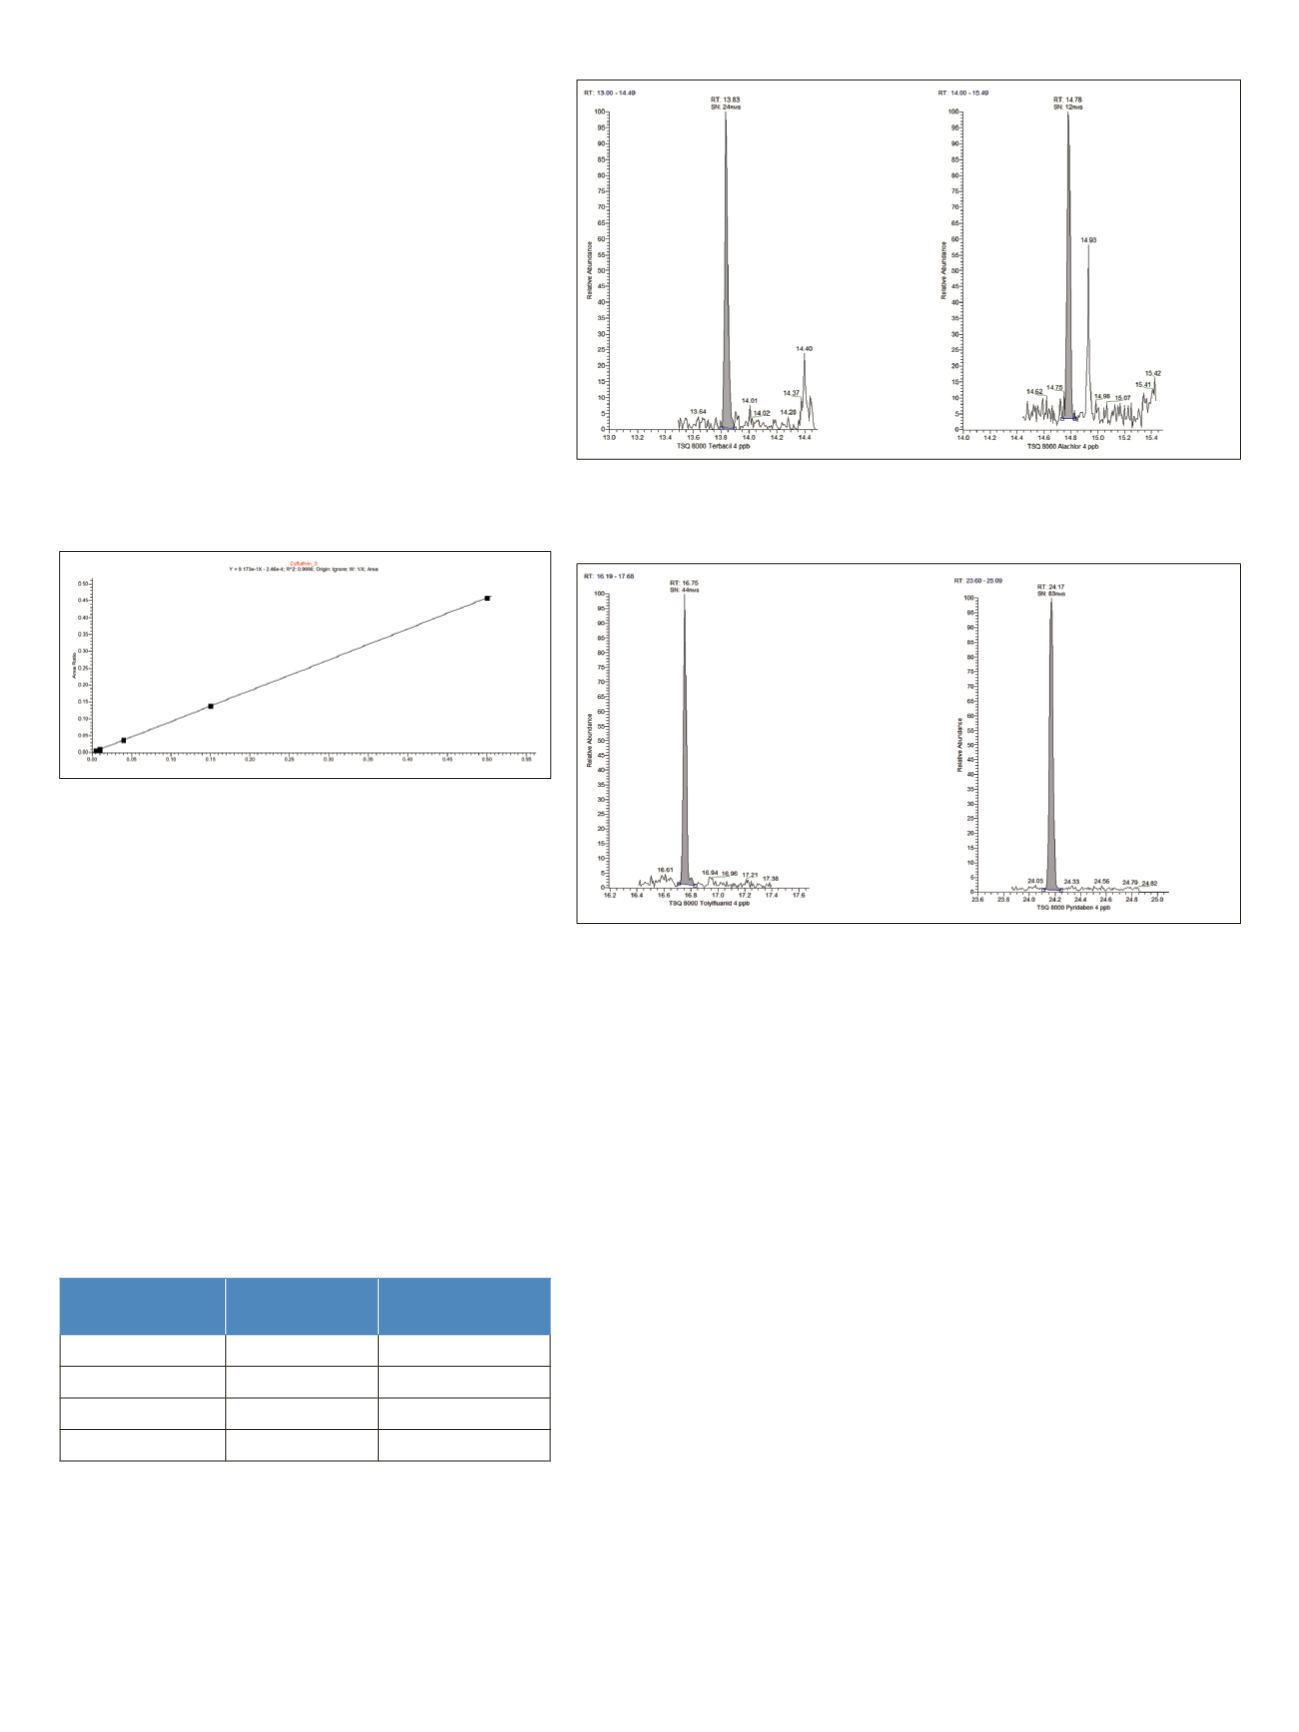
estimated. Using the 4 ppb (pg/µL) matrix standard level,
S/N values were used to estimate the limits of detection
(LOD). The S/N values in matrix are given in Table 1 for a
selection of critical compounds taken at retention times
that are affected most from the eluting matrix. Although
the compounds are eluting in heavily impacted matrix
regions of the chromatogram, the high selectivity of the
TSQ 8000 GC-MS/MS for the target pesticides at low
level against an intense matrix load is demonstrated in
Figure 3 and Figure 4.
Table 1. Detection limit S/N for selected pesticide compounds
in matrix
Robustness and Maintenance
Routine preventative maintenance on the GC was performed
using routine standard operating procedures. The calibration
chromatograms seen in Figures 3 and 4 have been acquired
after a persistent matrix load to the system through routine
analysis of more than 500 matrix samples.
This level of robustness meant that even with persistent
and very high matrix load, it was not necessary to clean
the removable ion source short term.
The innovative instant connect modularity of the injectors
and detectors of the TRACE 1310 GC, used here as the
front-end to the mass spectrometer, allows the user quick
accessibility to any injector part for rapid cleaning.
Furthermore the unique ability to replace the entire
injector module within minutes represents an excellent
way of postponing routine maintenance to when the
laboratory schedule allows while keeping the GC-MS/MS
system operational.
Pesticide
RT [min]
S/N @ 4 ppb
Terbacil
13:83
24
Alachlor
14:78
12
Tolylfluanid
16:75
44
Pyridaben
24:17
83
Figure 3. SRM peaks at 4 ppb from Terbacil (left, 161.1 > 88.0, CE 15 V) and Alachlor
(right, 188.1 > 130.1, CE 25 V). SRM transitions were taken from the Pesticide Method
Reference, 2nd ed. 2011. [4]
Figure 4. SRM peaks at 4 ppb from Tolylfluanid (left, 238.1 > 137.1, CE 15 V) and
Pyridaben (right, 309.1 > 147.1, CE 15 V). SRM transitions were taken from the Pesticide
Method Reference, 2nd ed. 2011. [4]


