
6
Post-acquisition data verification, integration, and relative
quantitation using HR/AM MS data (full-scan and
msxSIM data) was performed using Pinpoint software.
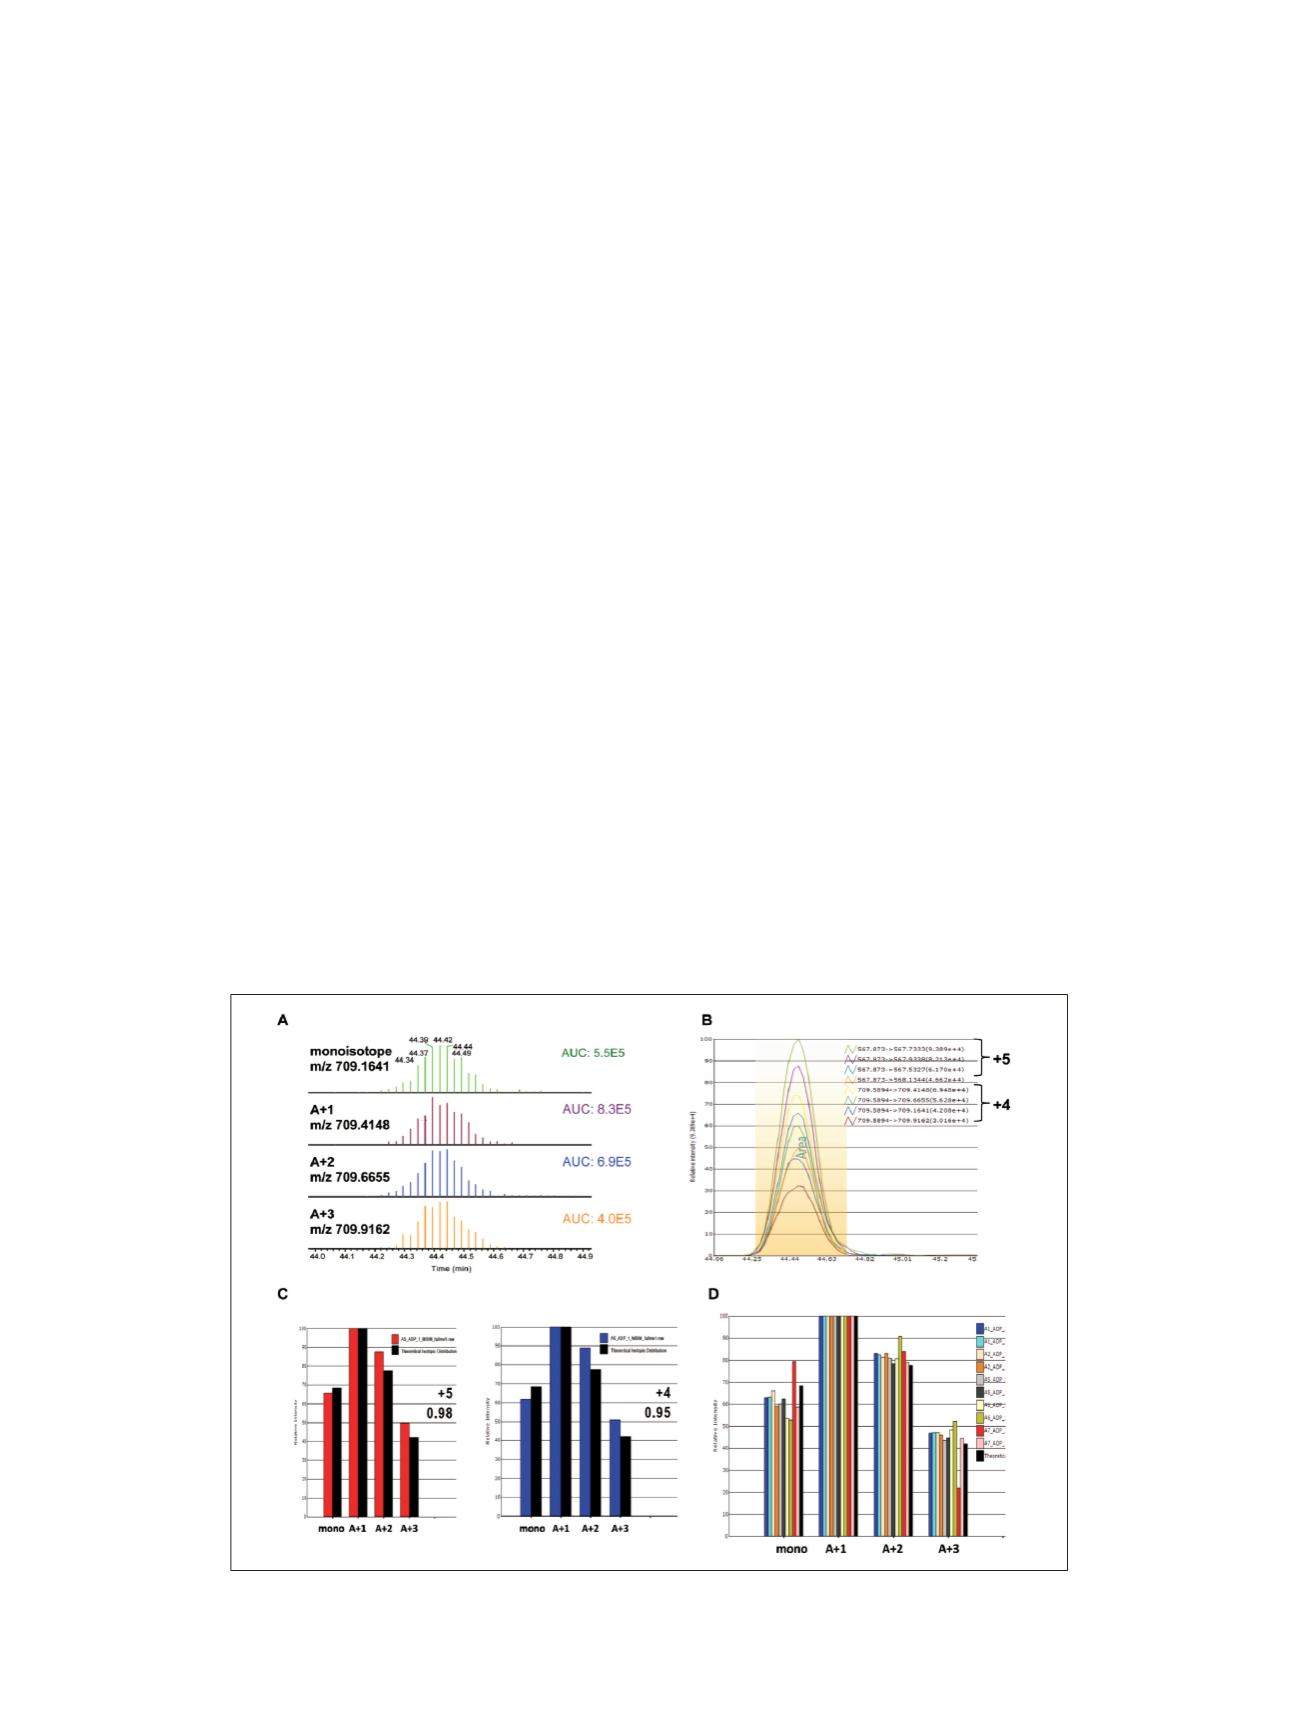
Figure 6A shows the individual isotopic XICs (displayed
in centroid mode) and the measured AUC values. A total
of 1.8 seconds was needed to cycle from the msxSIM
event to full-scan MS acquisition and back to msxSIM
detection resulting in 12 scans acquired across the elution
peak. User-defined sequence and modifications are used to
calculate the theoretical
m/z
value for the four most
abundant isotopes per charge state. An XIC extraction
tolerance of ±5 ppm was used for full MS and msxSIM
scans. Finally, an XIC is performed for each isotope
independently, grouped, and then overlaid to identify and
confirm target peptides versus retention time across all
attributed precursor charge states and corresponding
isotopes (Figure 6B).
High resolution and mass accuracy are also used to
maintain target ion selectively for both full-scan MS and
msxSIM MS analysis. Pinpoint software can determine
potential background interference per isotopic XIC.
Figure 6C shows the isotopic distribution overlap between
experimental and theoretical values for the +4 and +5
precursor charge states of the
NISHLDL
K
PQNILLSSLEKPHLK
peptide. The dot-
product correlation coefficients for the charge states are
0.95 and 0.98, respectively. The consistent peak shape and
relative isotopic distribution increase confidence in the
measured signal being attributed to the target peptide and
not to the matrix background. Figure 6D shows the
consolidated histogram for the +4 charge state for all
biological conditions and technical replicates. The
calculated correlation coefficient was greater than 0.95 for
all files, indicating the externally calibrated mass accuracy
was maintained for the duration of the sample analysis.
Figure 6. Data processing strategy using Pinpoint software for HR/AM MS and msxSIM data where (A) shows the
individual isotopic XIC plots in centroid display mode, (B) shows an overlaid XIC plot for retention-time determination,
(C) shows the isotopic distribution overlap between experimental and theoretical profiles for each charge state, and (D)
shows the resulting isotopic distribution for all resulting RAW files acquired in the study.
Kinase Inhibitor Profiling and IC
50
Determination
Using the combined full-scan MS and targeted msxSIM
methods described, relative abundance of kinase expression
can be readily assessed for multiple samples or treatment
conditions. Kinase inhibitor profiling is a powerful
application that can be assessed by measuring changes in
kinase active-site peptide relative abundance before and
after drug treatment. Inhibitor binding affinities can also
be determined by titrating inhibitor concentrations to
determine IC
50
values from dose-response curves. Targeted
msxSIM acquisition greatly aids this type of analysis as
inhibited kinases peptide signals will be decreased as
inhibitor concentrations increase.
Figure 7 shows the relative quantitation of three co-eluting
active-site peptides measured using the msxSIM method
from samples treated with increasing amounts staurosporine,
a broad-specificity kinase inhibitor. Figure 7A shows the
overlaid XIC plots for each targeted peptide per sample
with two technical replicates. The GCK kinase
(
DTVTSELLAAV
K
IVK
) and ULK3 kinase
(
NISHLDL
K
PQNILLSSLEKPHLK
) both show significant
inhibition at < 0.1 µM staurosporine while PKR kinase
(
DL
K
PSNIFLVDTK
) shows modest inhibition to
staurosporine treatment. Relative peptide signal intensity
was used to plot dose-response curves and calculate IC
50
values for each kinase (Figure 7B). For staurosporine
kinase inhibition profiling, comprehensive data is also
available from several alternative assays and is very
similar to values obtained in the present study.
5


