
4
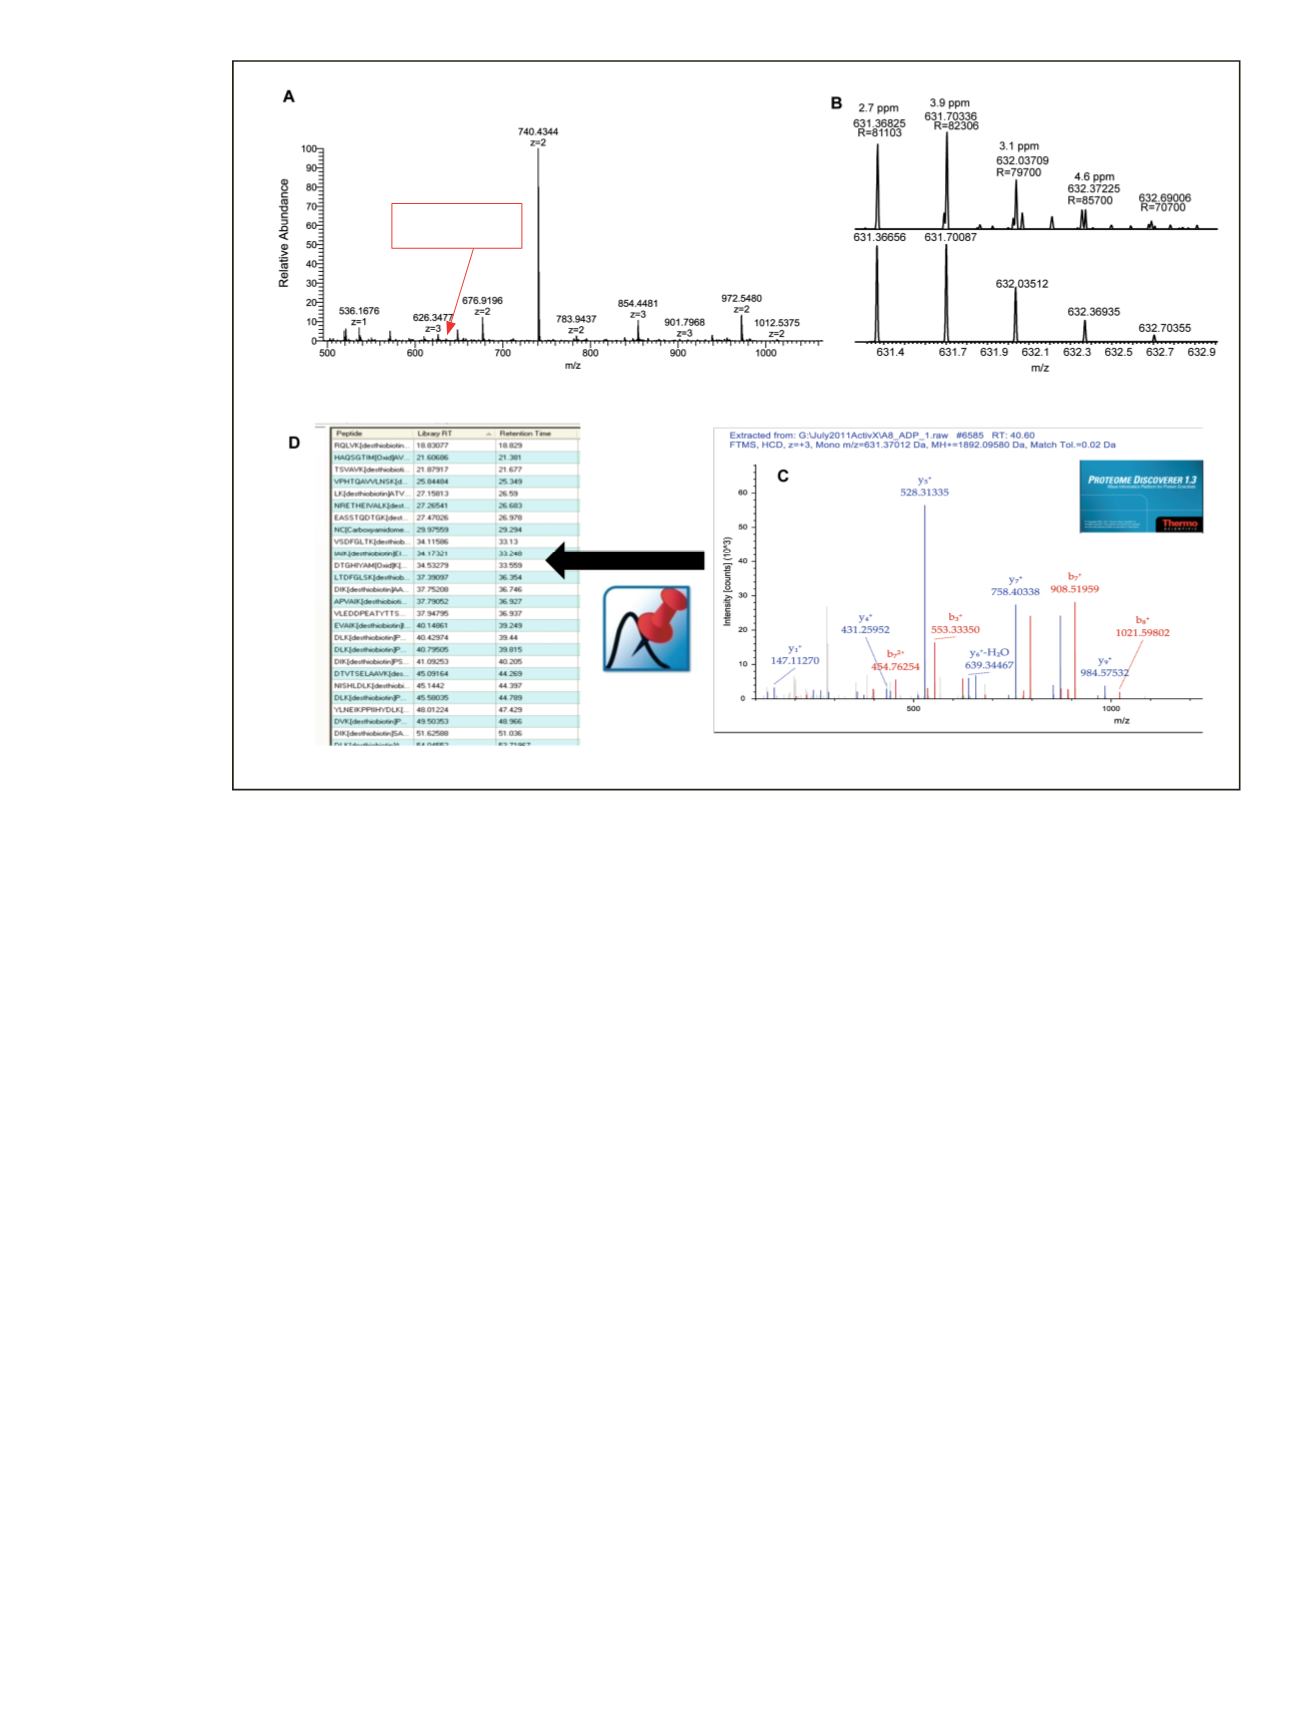
Figure 3. Processing strategy for building kinase active-site peptides spectral libraries and target lists. Example active-site peptide
DI
K
AGNILLTEPGQVK
from Tao1/3 kinase (A, B) was identified using Proteome Discoverer software from the HCD product ion spectrum
(C) with Pinpoint software used to automate target-list method building (D).
Targeted Active-Site Peptide MS Method
Development and Acquisition
Pinpoint analysis of kinase active-site peptide relative
abundance in the enriched samples revealed a large dynamic
range of peptide signals. More abundant active-site peptides
were quantified using HR/AM full-scan MS and not
included in the targeted experiment. Lower-abundance
peptides were selected for a multiplexed SIM (msxSIM)
acquisition to improve peptide ion signal intensity. A
major advantage of the Q Exactive mass spectrometer is
simultaneous C-trap filling during Orbitrap detection
(Figure 4A and B).
4
This greatly reduces cycle times as
selected ions can be trapped and detected in parallel.
When targeted msxSIM events are scheduled, this benefit
can be enhanced further by the trapping of multiple target
ions in parallel. During Orbitrap detection, the C-trap is
sequentially filled by ions defined by narrow mass ranges.
Our experiment limited the multiplexing to a maximum of
4 mass windows but software capabilities enable up to 10
mass ranges to be collected and analyzed simultaneously.
Cycling between full-scan MS and msxSIM is used to
maintain target selectivity.
This approach of switching between full-scan MS and
msxSIM was applied for targeted analysis of the ULK3
kinase active-site peptide
NISHLDL
K
PQNILLSSLEKPHLK
(Figure 4C). A narrow retention time region is displayed
in centroid mode for which a total of 1.2 seconds was
used to acquire data in both full-scan and SIM modes.
The extracted ion chromatogram (XIC) plot from the
full-scan mode shows a large number of peaks despite
filtering using a mass tolerance of ±5 ppm. The highlighted
region covers the expected elution time for the targeted
active-site peptide, which was only 3% of the base peak
intensity. The XIC profile for the SIM event shows that
the scheduled, targeted data acquisition method clearly
measures the peak of interest without interference.
Tao1/3
DI
K
AGNILLTEPGQVK


