
5
Conclusion
An SRM-MSIA-based analysis method was developed
capable of simultaneously monitoring full-length PTH and
truncated variants with analytical metrics suitable for clinical
research use. Using a workflow incorporating postcapture
tryptic digestion, surrogate peptides representative of
PTH1–84 and PTH7–84 were generated and then monitored
using SRM. In addition, tryptic fragments spanning other
regions of PTH were incorporated into the analysis. Relative
ion signals for these species confirmed that the clinical
research method was functional and created the basis for a
standard PTH profile. This standard profile was expanded to
include a peptide representative of a novel variant,
PTH34–84, clipped at the N-terminus. In total, 32 SRM
transitions were analyzed in a multiplexed method to
monitor nonvariant PTH sequences with >50% sequence
coverage, as well as the two truncated variants. Peptides
exhibited linear responses (R
2
= 0.90–0.99) relative to the
limit of detection for an intact recombinant human PTH
concentration of 8 ng/L. Limits of quantification were
16–31 ng/L, depending on the peptide. Standard error of
analysis for all triplicate measurements was 3%–12% for all
peptides, with <5% chromatographic drift between
replicates. The CVs of integrated areas under the curve for
54 separate measurements of heavy peptides were 5%–9%.
Pinpoint software was used to develop and implement
“intelligent SRM” data acquisition strategies, increasing
instrument efficiency by avoiding the need to monitor all of
the specified transitions at all times. Use of these techniques
may be particularly advantageous for clinical research
laboratories in methods where a large number of PTH
variants are monitored, or where the analyzed sample
contains a complex mixture of PTH-derived peptides and
components produced by digestion of compounds in the
sample matrix.
Acknowledgments
The authors would like to thank Michael Athanas (VAST
Scientific, Cambridge, MA); Ravinder J. Singh and David R.
Barnidge (Mayo Clinic College of Medicine, Rochester, MN);
and Paul Oran, Chad Borges, and Randall W. Nelson (Biodesign
Institute, Arizona State University, Tempe, AZ) for their valuable
contributions to this work.
0.E+00
1.E+03
2.E+03
3.E+03
4.E+03
5.E+03
6.E+03
7.E+03
8.E+03
Raw Signal Intensity
LQDVHNFVALGAPLAPR (aa28-44)
Renal
Control
0.E+00
1.E+03
2.E+03
3.E+03
4.E+03
5.E+03
6.E+03
Raw Signal Intensity
Renal
Control
SVSSEIQLMHNLGK (aa1-13)
0.E+00
1.E+02
2.E+02
3.E+02
4.E+02
5.E+02
6.E+02
7.E+02
8.E+02
Raw Signal Intensity
HLNSMER (aa14-20)
0.E+00
5.E+03
1.E+04
2.E+04
2.E+04
3.E+04
3.E+04
4.E+04
Raw Signal Intensity
FVALGAPLAPR (aa34-44)
8.E+03
9.E+03
ADVNVLTK (aa73-80)
Renal
Control
Renal
Control
0.E+00
1.E+03
2.E+03
3.E+03
4.E+03
5.E+03
6.E+03
7.E+03
8.E+03
Raw Signal Inte sity
LQDVHNFVALGAPLAPR (aa28-44)
Renal
Control
0.E+00
1.E+03
2.E+03
3.E+03
4.E+03
5.E+03
6.E+03
Raw Signal Intensity
Renal
Control
SVSSEIQLMHNLGK (aa1-13)
0.E+00
1.
2
2.
3.E+02
4.
5.E
6.E+02
7.E+02
8.E+02
Raw Signal Inte sity
HLNSMER (aa14-20)
0.E+00
5.E+03
1.E+04
2.E+04
2.E+04
3.E+04
.
4.
Raw Signal Intensity
FVALGAPLAPR (aa34-44)
ADVNVLTK (aa73-80)
Renal
Control
Renal
Control
0.E+00
1.E+03
2.E+03
3.E+03
4.E+03
5.E+03
6.E+03
7.E+03
8.E+03
Raw Signal Inte sity
LQDVHNFVALGAPLAPR (aa28-44)
Renal
Control
0.E+00
1.E+03
2.E+03
3.E+03
4.E+03
5.E+03
6.E+03
Raw Signal Intensity
Renal
Control
SVSSEIQLMHNLGK (aa1-13)
0.E+00
1.E+02
2.E+02
3.E+02
4.E+02
5.E+02
6.E+02
7.E+02
8.E+02
Raw Signal Inte sity
HLNSMER (aa14-20)
0.E+00
5.E+03
1.E+04
2.E+04
2.E+04
3.E+04
3.E+04
4.E+04
Raw Signal Inte sity
FVALGAPLAPR (aa34-44)
ADVNVLTK (aa73-80)
Renal
Control
Renal
Control
0.E+00
1.E+03
2.E+03
3. +03
4.
5.
6
7.
8.
Raw Sign l Intensity
LQDVHNFVALGAPLAPR (aa28-44)
Renal
Control
0.E+00
1 3
2
3.
4.E+03
5.E+03
6.E+03
Raw Signal Intensity
Renal
Control
SVSSEIQLMHNLGK (aa1-13)
0.E+00
1.E+02
2.E+02
3.E+02
4.E+02
5.E+02
6.E+02
7.E+02
8.E+02
Raw Signal Intensity
HLNSMER (aa14-20)
0.E+00
5.E+03
1.E+04
2.E+04
2.E+04
3.E+04
3.E+04
4.E+04
Raw Signal Intensity
FVALGAPLAPR (aa34-44)
Renal
Control
Renal
Control
0.E+00
0.E+00
1.E+03
2.E+03
3.E+03
4.E+03
5.E+03
6.E+03
7.E+03
8.E+03
9.E+03
Raw Signal Intensity
ADVNVLTK (aa73-80)
Renal
Control
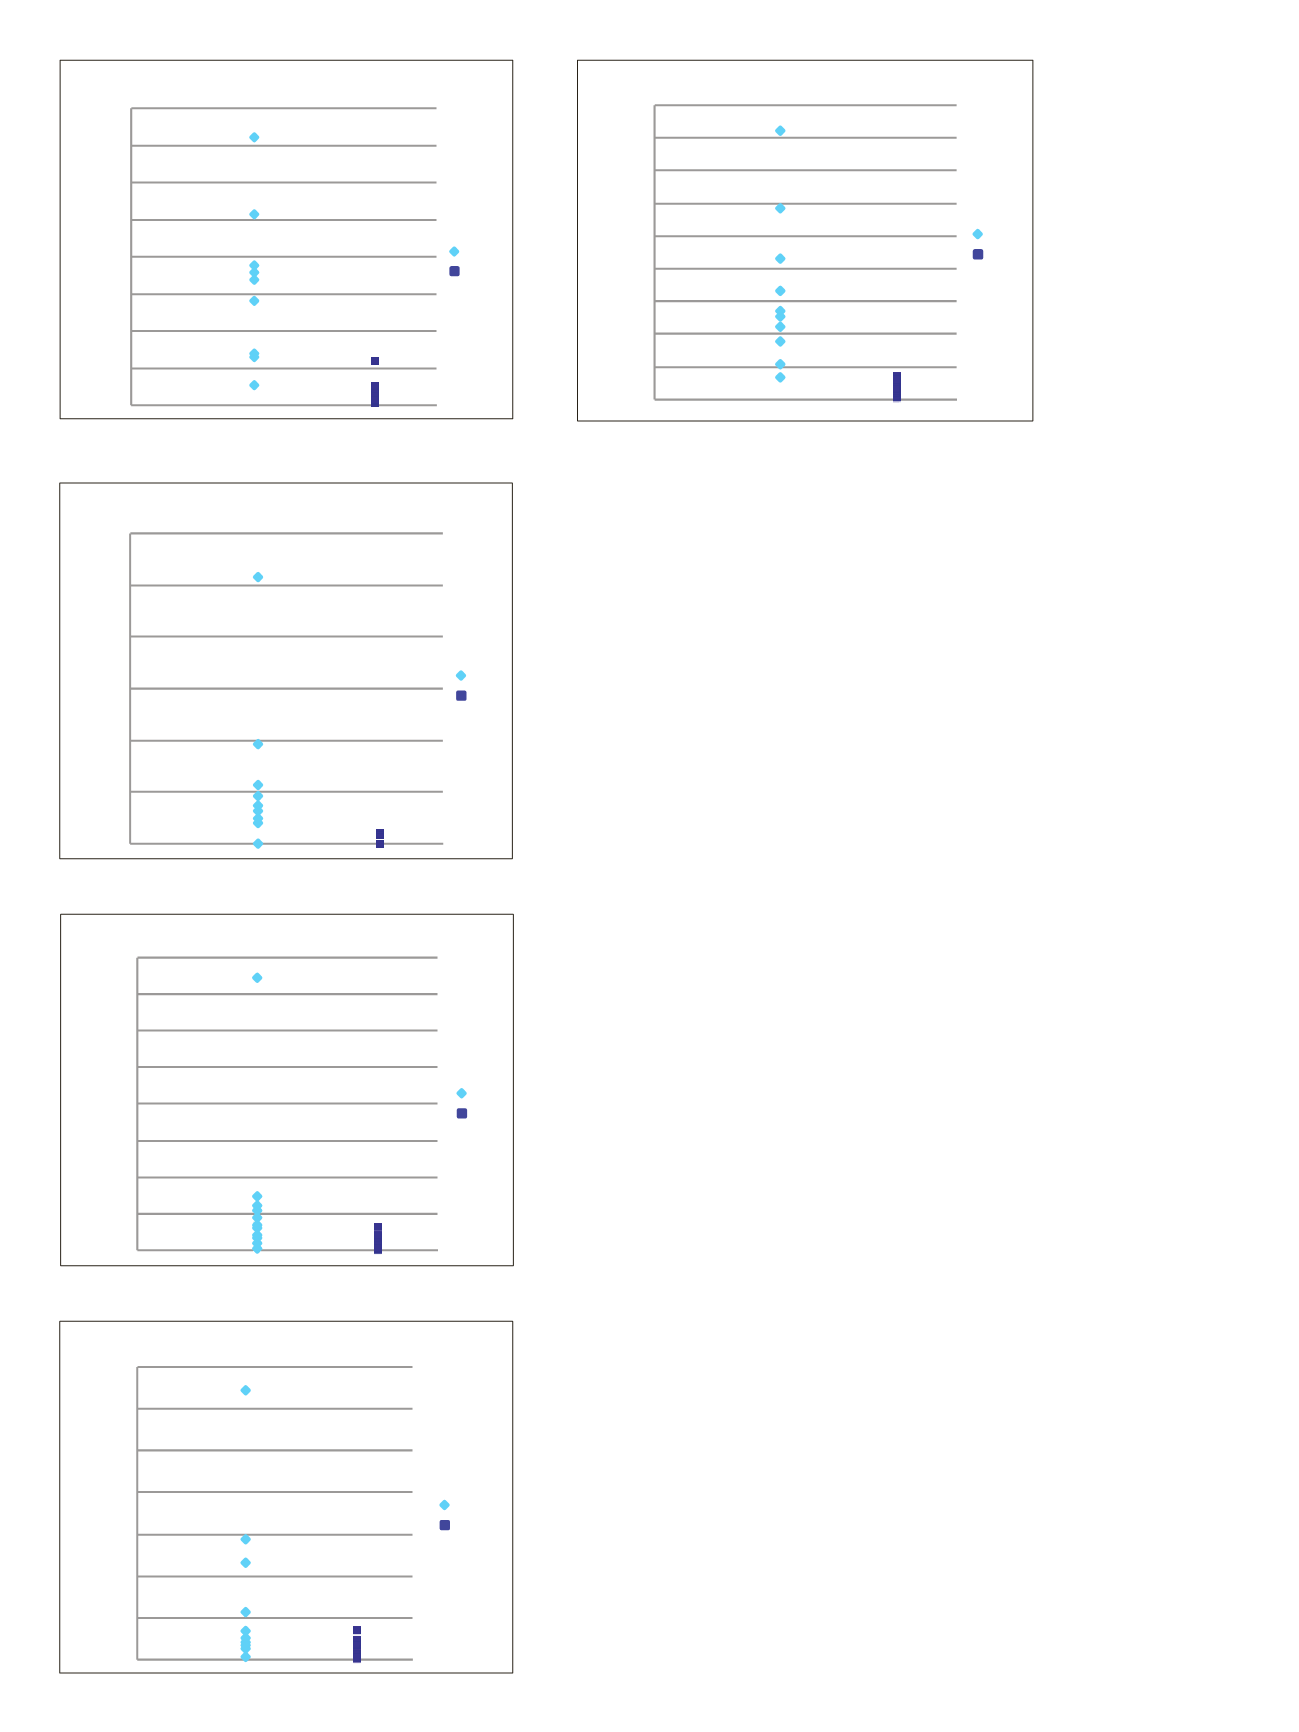
Figure 5. SRM quantitative ratios and sample variances of PTH
peptides in samples from renal failure patients (Renal) and
healthy controls. Ratios refer to the average value of the renal
cohort divided by the average value of the healthy control cohort.


