


 549 / 658

7
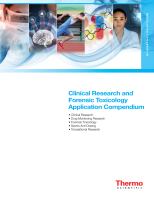
Figure 7. Targeted msxSIM analysis for low-level co-eluting active-site peptides. Comparative overlaid XIC plot at each titrated
staurosporine level (A). Dose-response curves of the measured peptide signal inhibition as a function of titrated staurosporine
concentration with calculated IC
50
values for each active-site peptide (B).
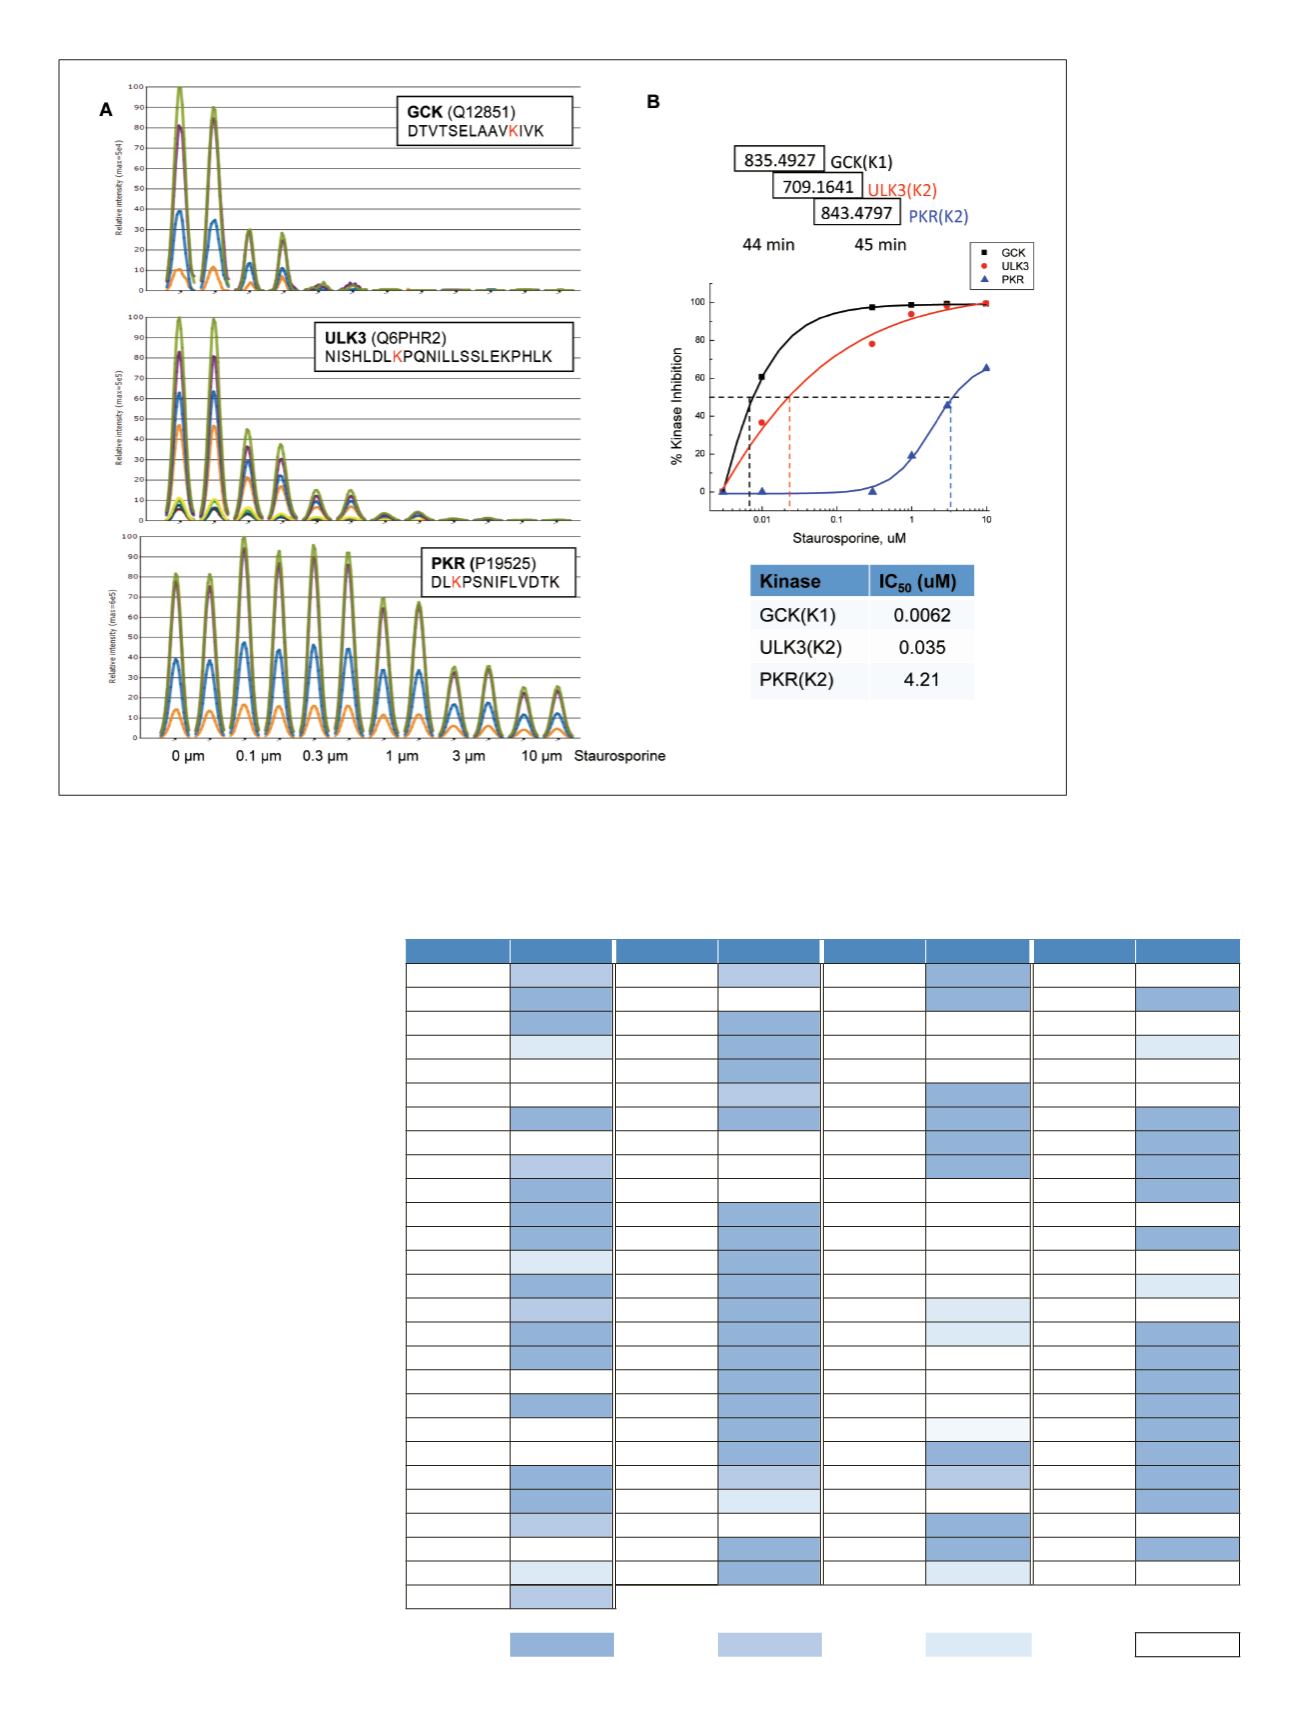
Table 3 lists all kinases quantified in
this study after staurosporine treatment.
By comparing relative intensity of
untreated to staurosporine-treated
(10 µM) samples, kinases were
grouped by their percent inhibition.
This analysis clearly shows which
kinases bind to staurosporine and can
be used to identify kinase subfamilies
that share common inhibition profiles.
Table 3. Identified kinases (active-site
peptides) and corresponding relative
quantitation determined using
HR/AM MS data after inhibitor treatment.
Kinase peptides measured using targeted
multiplexed SIM are shown in bold.
Kinase
% Inhibition
Kinase
% Inhibition
Kinase
% Inhibition
Kinase
% Inhibition
ABL1/2
75%
EphB4
88.00%
MARK2
100.00%
PLK1
0.00%
ACK
100.00%
Erk1/2
0.00%
MARK3
100.00%
PKN2
100.00%
AMPKa1/2
100.00%
FAK1
100.00%
MASTL
0.00%
PRPK
0.00%
ATR
50.00%
FER
100.00%
MET
0.00%
PRP4
40.00%
ATM
0.00%
GCK
100.00%
MLKL
0.00%
PRKDC
0.00%
ARAF
0.00%
GCN2
75.00%
MLK3
100.00%
PRKCI
0.00%
BAZ1B
100.00%
JAK1
100.00%
MST3
93.00%
ROCK1/2
100.00%
BRAF
0.00%
IKKa
0.00%
MST4
100.00%
RSK1
95.00%
CaMK1a
75%
IKKb
0.00%
NDR1/2
95.00%
RSK1/2/3
100.00%
CaMK2g
100.00%
ILK
10.00%
NEK1
20.00%
RSK2(1)
100.00%
CAMKK2
100.00%
IRE1
90.00%
NEK3
0.00%
RSK2(2)
0.00%
CASK
100.00%
IRAK4
100.00%
NEK4
0.00%
SLK
100.00%
CDC2
50.00%
KHS1/2
100.00%
NEK7
0.00%
SMG1
20.00%
CDK5
100.00%
LATS1
100.00%
NEK8
0.00%
SRPK1/2
50.00%
CDK6
65.00%
LKB1
100.00%
NEK9
40.00%
STLK6
0.00%
CDK7
100.00%
LOK
100.00%
OSR1
30.00%
SRC
100.00%
CDK8/11
100.00%
LYN
100.00% p70S6Kb
0.00%
TAO1/3
100.00%
CDK9
0.00%
MAP2K1/2
90.00%
p70S6K
15.00%
TAO2
100.00%
CDK10
100.00%
MAP2K3
100.00%
PAN3
0.00%
TBK1
100.00%
CDK12
0.00%
MAP2K4
95.00%
PDK1
85.00%
TEC
100.00%
CDK13
0.00%
MAP2K6
100.00%
PHKg2
100.00%
TP53RK
100.00%
CHK1
100.00%
MAP3K1
80.00%
PKCi
80.00%
TLK1/2
100.00%
CHK2
97.00%
MAP3K2
50.00%
PITSLRE
0.00%
ULK3
100.00%
CSK
85.00%
MAP3K4
0.00%
PKD2
100.00% Wnk1/2/4
0.00%
EF2K
0.00%
MAP3K5
100.00%
PKD3
100.00%
YES
100.00%
EGFR
30.00%
MARK1/2
100.00%
PKR
30.00%
ZAK
0.00%
EphA2
88.00%
% Inhibition > 90%
60%-89%
30%-59%
<30%