
8
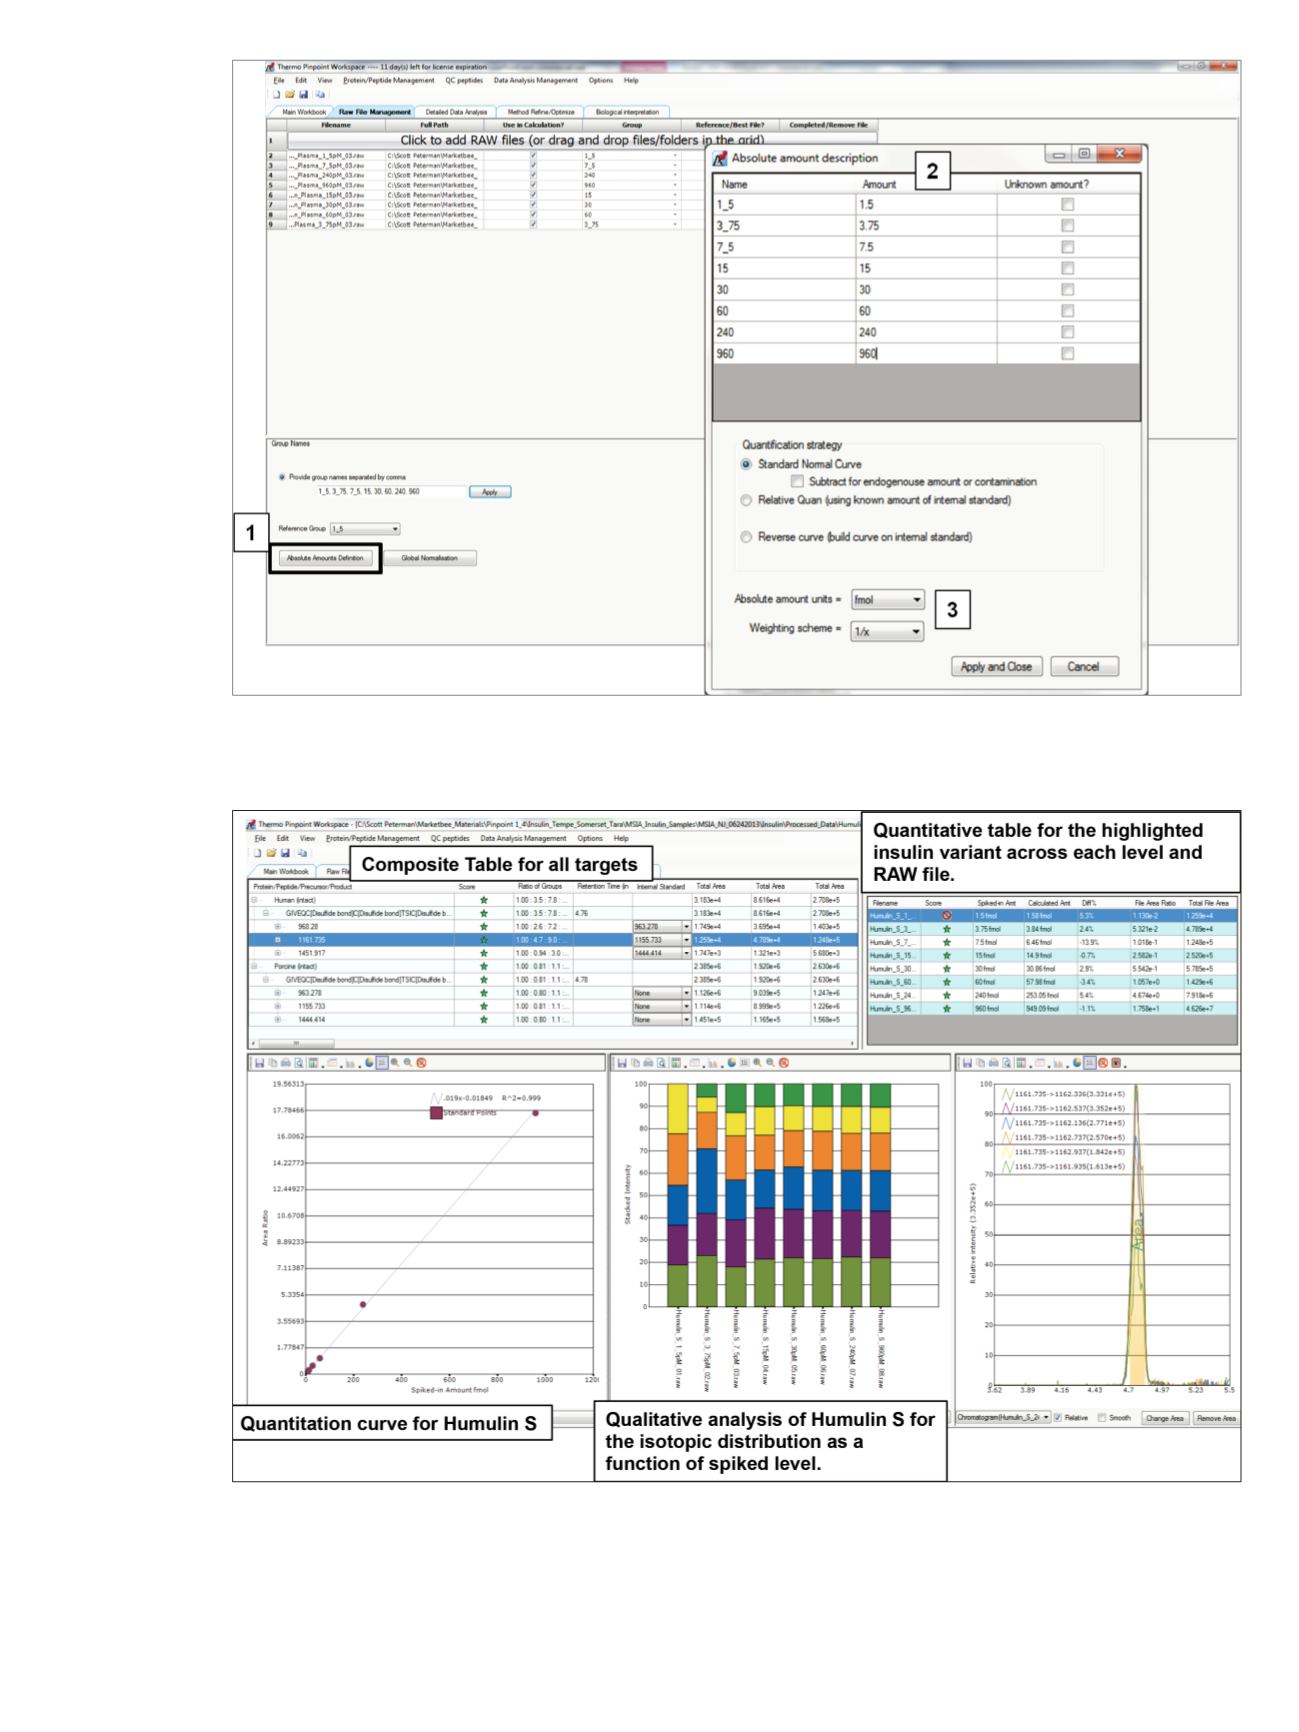
Figure 8. Quantitative parameters were defined by clicking on “Absolute Amounts Determination” (1) to open the dialog box containing
user-defined group names (2). Values were assigned or defined as unknown. Finally the units to display and the weighting scheme to
apply to the calibration curve (3) were selected.
Figure 9. Automated data processing using Pinpoint software. The Detailed Data Analysis tab provided the composite quantification
results for Humulin S from 1.5 to 960 pM spiked into PBS/BSA matrix.


