
4
LC-MS methods, particularly those employing HRAM
detection, provide significant advantages over enzyme-
linked immunosorbent assay (ELISA), capillary
electrophoresis (CE), and ultraviolet (UV) methods
because the selectivity of MS allows detection of
co-eluting analogs. Three co-eluting insulin analogs shown
in Figure 1 were easily separated based on the accurate
m/z
values of each precursor charge state and
corresponding isotopes. Comparative analyses for the
three insulin variants (porcine, human, and Apidra),
including XICs and the total isotopic distribution, are
shown in Figure 3. Pinpoint software automatically
calculated the dot product correlation coefficient for the
charge states that was used to evaluate isotopic
distribution overlap and filter results. Here the dot
product scores for each charge state and analog were
greater than 0.9, an excellent match.
1161.5
1162.0
1162.5
1163.0
1163.5
1164.0
m/z
0
10
20
30
40
50
60
70
80
90
100
0
10
20
30
40
50
60
70
80
90
100
Relative Abundance
1162.3384
1162.1372
1162.5384
1162.7383
1161.9371
1162.9387
1163.1391
1161.7375
1163.3386
1161.5357
1163.5349
1163.9267
1162.3362
1162.5366
1162.1358
1162.7369
1162.9372
1161.9354
1163.1375
1163.3378
1161.7348
1163.5381
1163.7383
1163.9386
NL:
5.86E4
Glu_Lan_Plasma_960pM_03#
642-660 RT: 4.66-4.78 AV:
19 T: FTMS + p ESI Full ms
[700.00-2000.00]
NL:
4.36E3
C
257
H
383
N
65
O
77
S
6
+H
:
C
257
H
388
N
65
O
77
S
6
p
(gss
,s
/p:40)Chrg5
R:32000 Res
.Pwr. @FWHM
Experimental
Theoretical
A+1
A+2 A+3 A+4
A+6
A+5
A+7
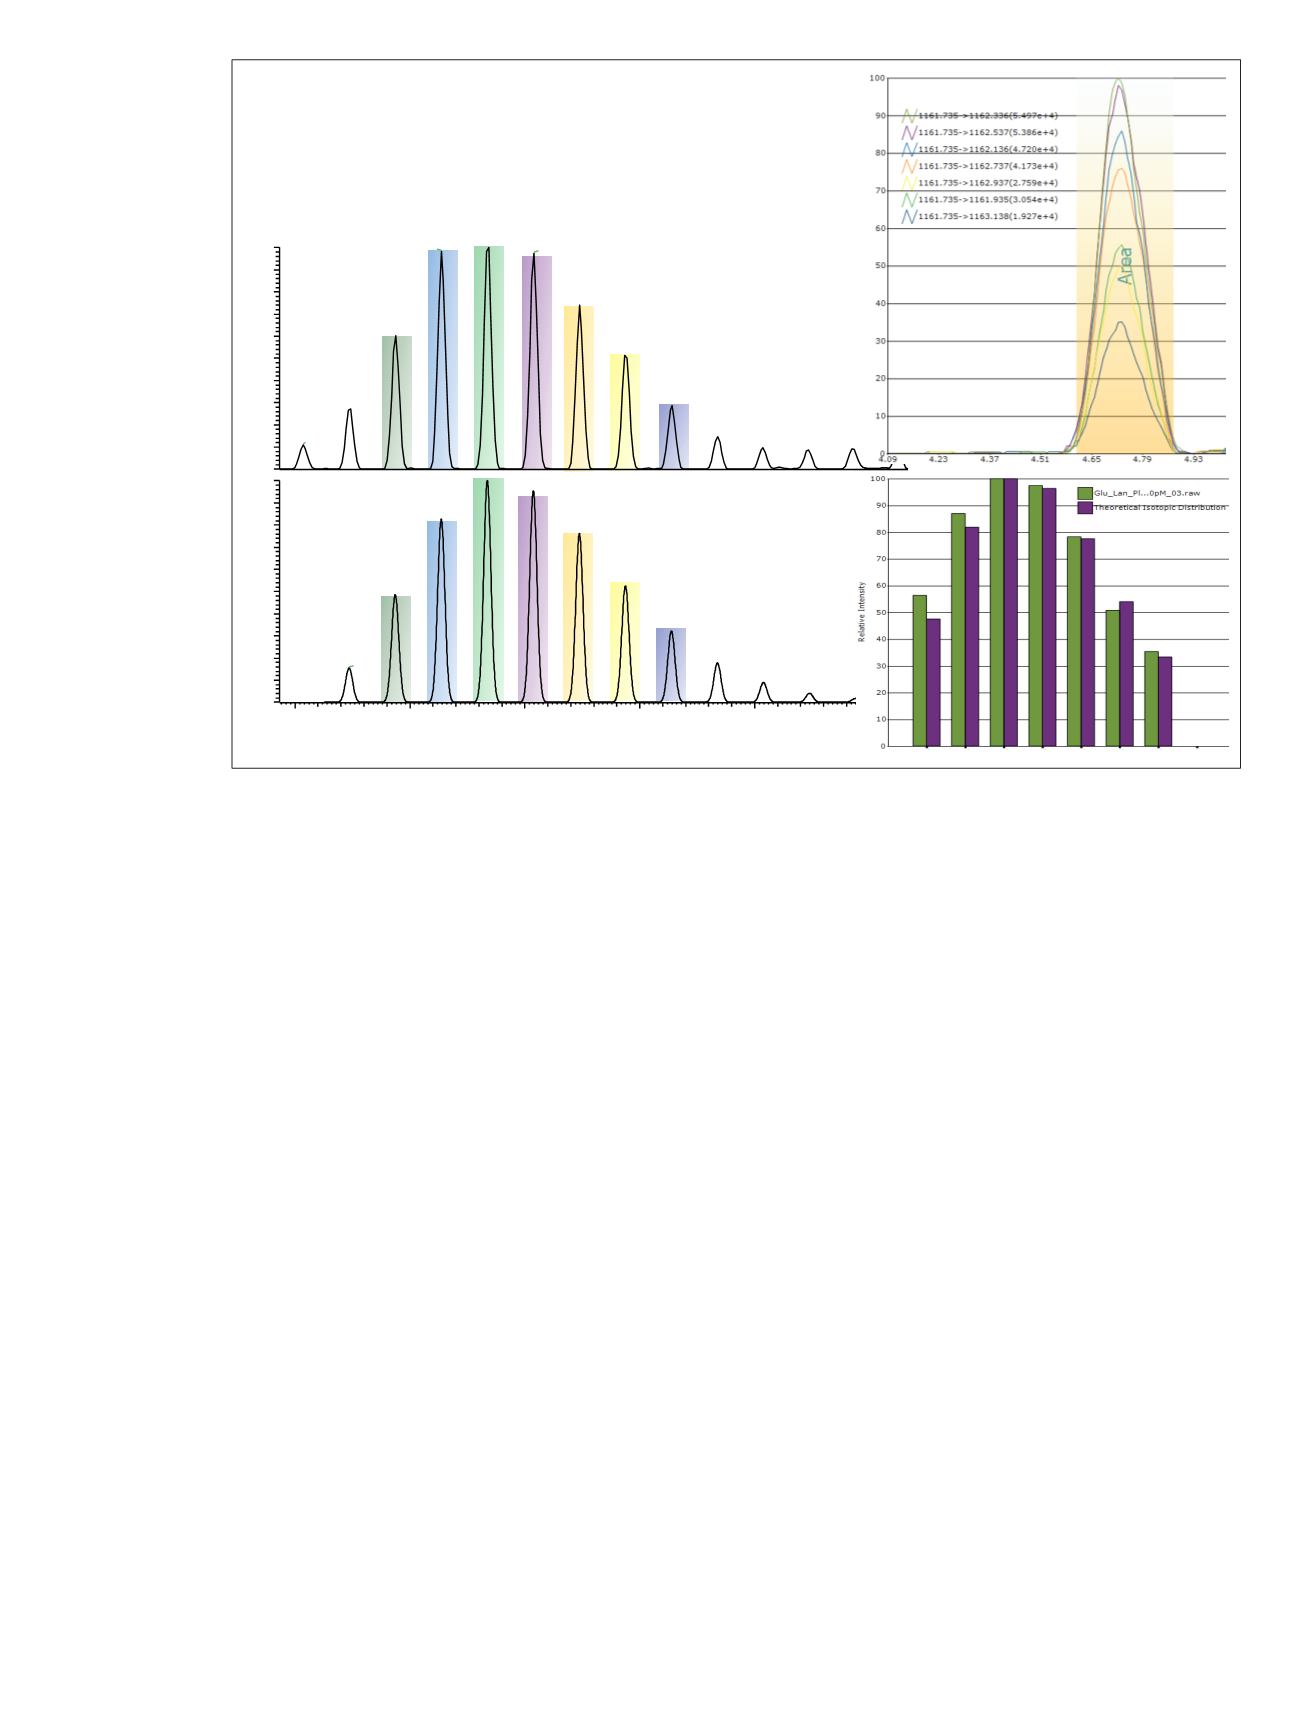
Figure 2. Data processing using Pinpoint software. Figure 2a shows the targeted data extraction based on isotopic
m/z
values for the
seven most abundant isotopes, and a ±7 ppm extraction tolerance based on the theoretical isotopic distribution. Figure 2b shows the
overlaid XICs for each of the targeted isotopes. The AUC values for each isotope were used to evaluate the scoring shown in Figure 2c,
where the relative AUC values for the collective isotopic distribution were compared to the theoretical value.


