
10
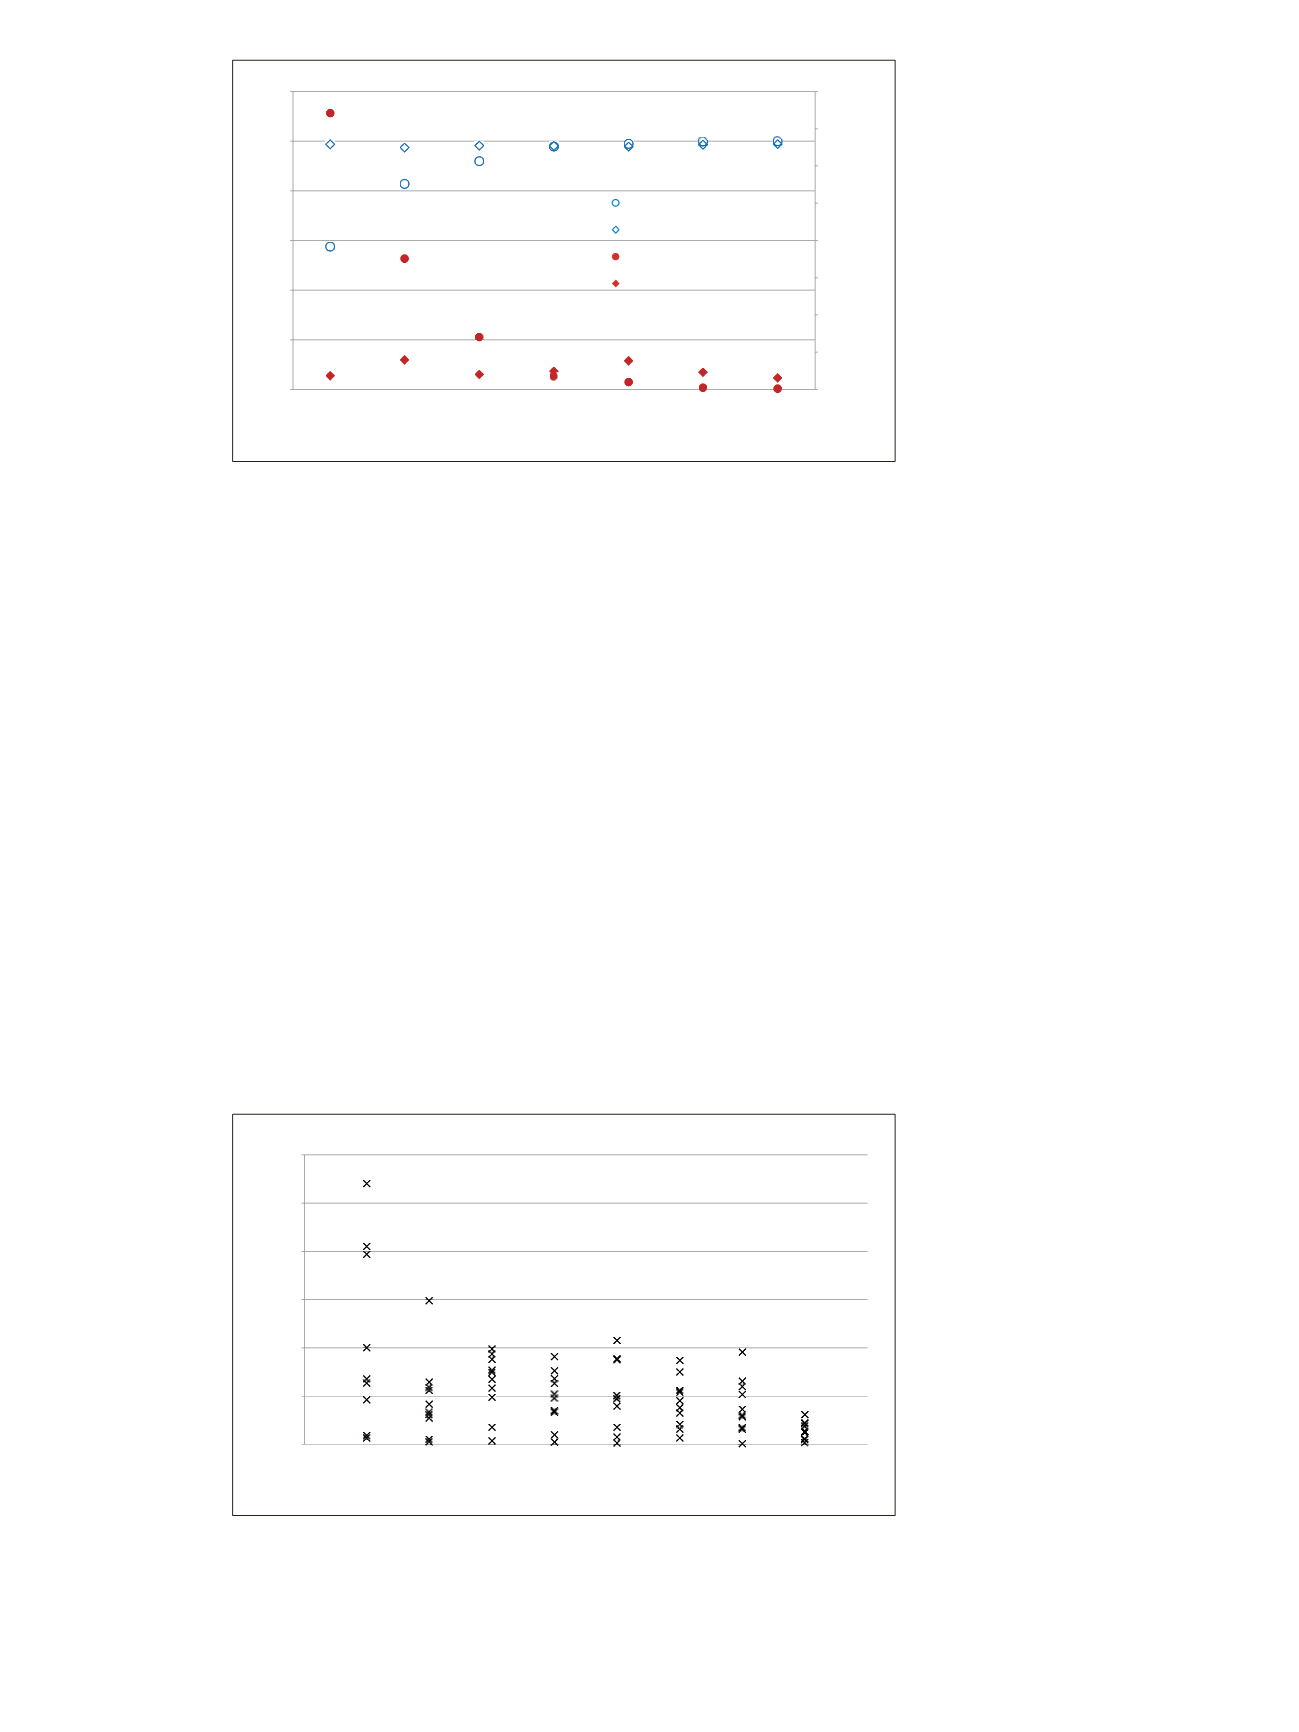
In combination with the average dot product coefficient,
the standard deviation for the measurements
demonstrated the workflow’s effectiveness. The deviation
in the isotopic distribution showed that each insulin
variant was routinely detected with four or more isotopes.
Predicted relative abundance values were maintained at
the 1.5 pM level.
Figure 12 shows the RSD values for all insulin analogs as
a function of amounts spiked in the PBS/BSA and
human plasma matrix. The greatest spread in measured
%RSD was at the 1.5 pM level where three of the
11 measurements exceeded 20% spread. Only one
measurement at the 3.75 and 30 pM level exceeded 20%
spread in %RSD. The errors were attributed to using only
one measurement per level, per quantitation curve. The
overall groupings per level were well within acceptable
error. It should also be noted that the lowest four levels
used in this study were 50–100 times lower than the
previously published lower limits of quantitation.
0
0.05
0.1
0.15
0.2
0.25
0.3
0.35
0.4
0
0.2
0.4
0.6
0.8
1
1.2
Standard Deviation for Dot Product Correlation
Coefficient
Averaged Dot Product Correlation Coefficient
Spiked Insulin Variant Amount (pM)
Spiked Insulin Analogs
Porcine ISTD
Spiked Insulin Analogs
Porcine ISTD
1.5
3.75
7.5
15
30
60
240
0
10
20
30
40
50
60
%RSD
Spiked Insulin Analog Amount (pM)
1.5
3.75
7.5
15
30
60
240
960
Figure 11. Dot product correlation coefficients for each insulin analog spiked into
both matrices, and for porcine insulin. The standard deviation was also plotted per
spiked level.
Figure 12. Spread in %RSD values for all insulin analogs across the spiked levels.
The %RSD values are based on the individual quantitation curves.


