
7
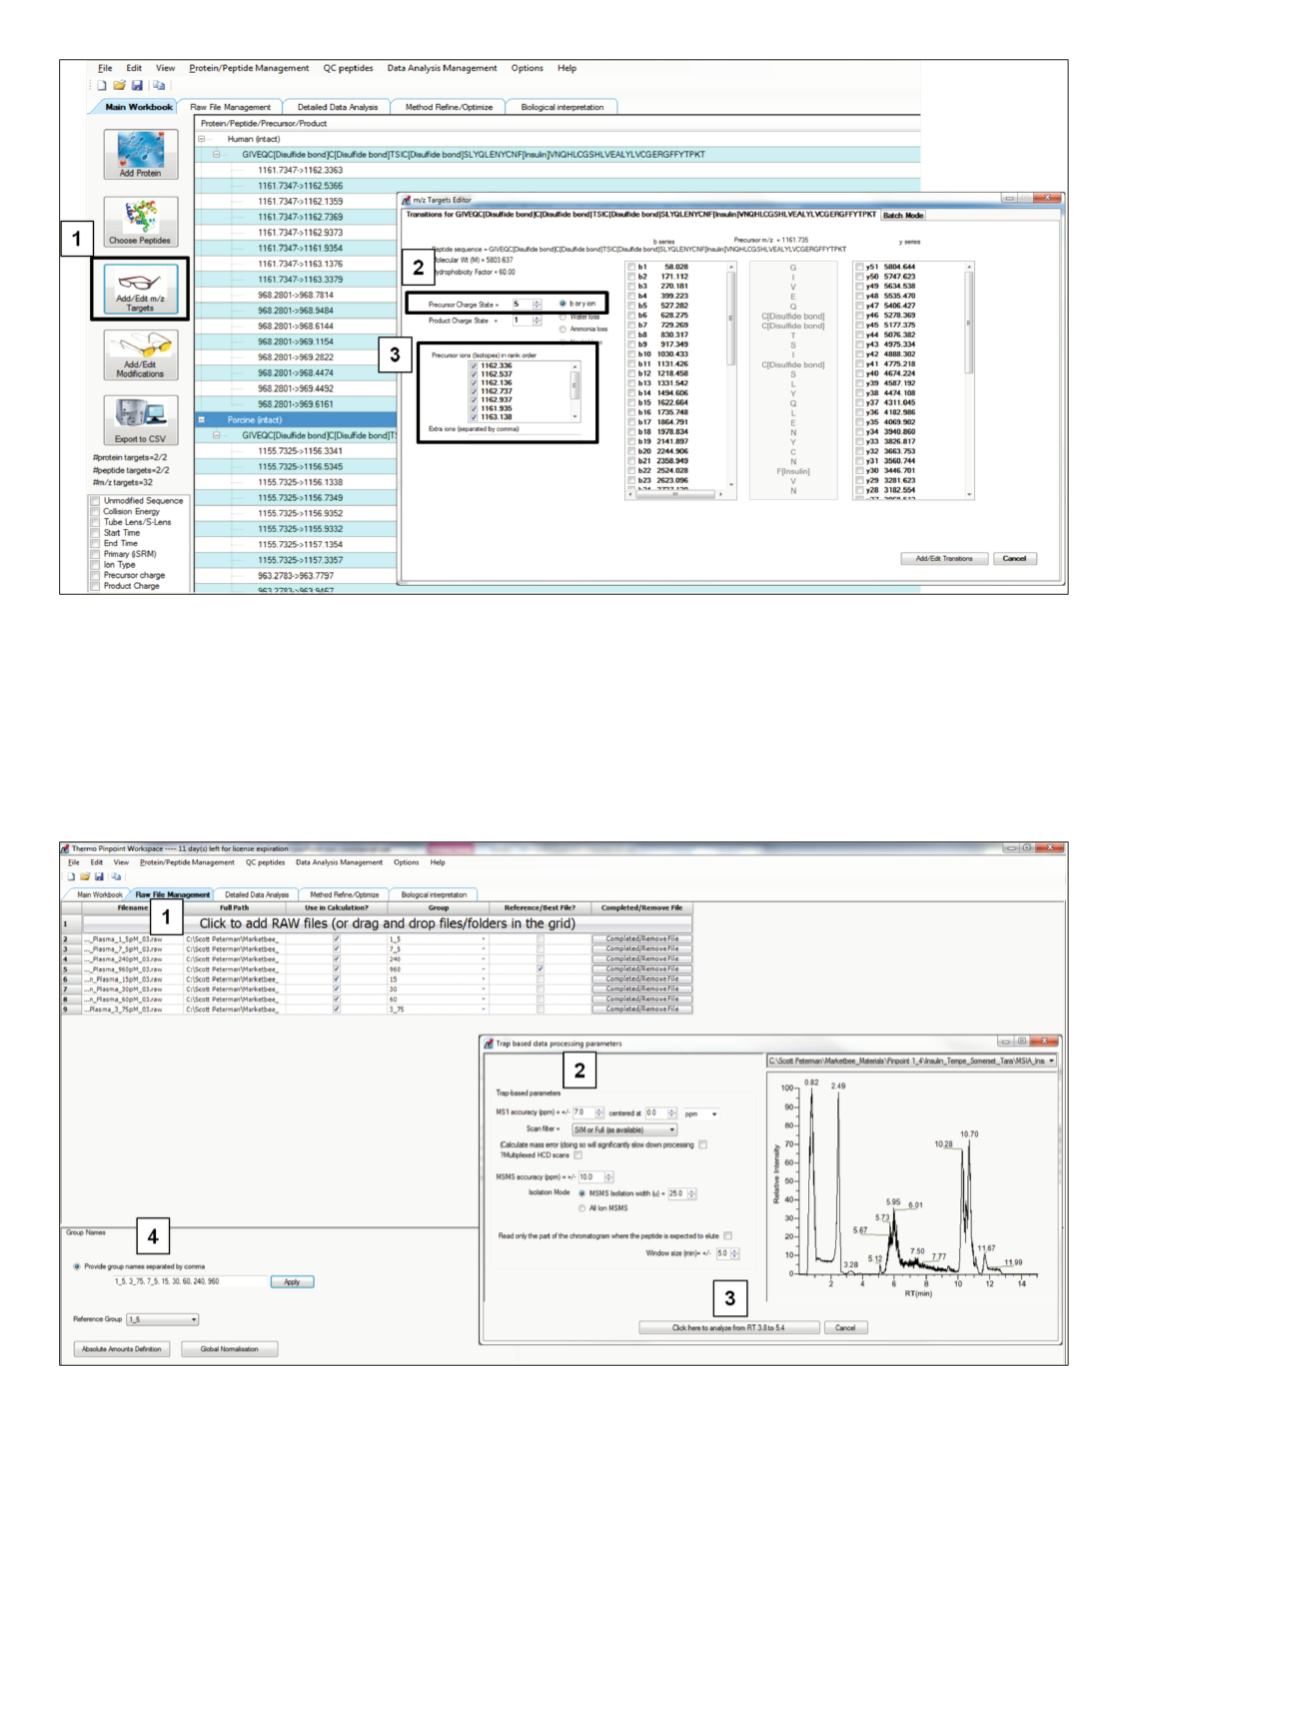
After the Main Workbook was created, the RAW files
were batch processed as shown in Figure 7.
For larger targets, at least six isotopes per charge state
were selected to increase the qualitative information used
for quantitation. In addition, multiple charge states were
incorporated into the automated data extraction.
Figure 6. Method to assign
m/z
values to each targeted insulin variant. “Add/Edit
m/z
Targets” (1) was selected to display sequence-
specific information for the highlighted sequence. The Batch Mode Tab was used to apply the settings globally. To determine the
m/z
for a specific sequence, the precursor charge state was selected (2), and the isotopes checked (3).
Figure 7. RAW data for processing was imported by clicking on the top bar (1) and selecting RAW files. The extraction parameters—
including precursor mass tolerance (2) and retention time window for data extraction (3)—were set. After the extraction values were
selected and data processing had begun, the group names (4) used for data organization were assigned.
For quantitative experiments, the expected values per
group were entered (Figure 8).
After all values were set, automated data processing was
completed in 30 minutes. Pinpoint software consolidated
qualitative and quantitative results in an interactive
display that facilitated review and customized reporting
(Figure 9). The top left table displays the AUC values for
the levels of the spiked analytes (e.g. isotopes, precursor
charge states, and the summed values). The method of
reporting AUC values enabled display of specific values
for each level, which could be expanded or reduced as
desired. Each entry was scored based on the calculated dot
product for isotopic distribution, making it easy to
determine which rows failed the filter.


