
3
Figure 2a shows the initial data extract using multiple
isotopes per charge state. Pinpoint software determined
the isotopic distribution and
m/z
list and created the
theoretical profile based on user-defined sequence and
possible modifications. Each isotopic
m/z
value was used
to create an extracted ion chromatogram (XIC) with a
±7 ppm window, providing first-level qualitative analysis.
The resulting XICs were overlaid to determine the
retention time (Figure 2b) and AUCs were calculated for
all isotopes. The overlaid peak profiles enabled scoring the
LC component based on common peak shapes (peak
state/end, apex, and symmetry) for the collection of
isotopes of one or more precursor charge states. The
color-coding capability of Pinpoint software facilitated
data review.
The AUC values for each isotope were calculated and then
used to determine background interference. Figure 2c
shows the Pinpoint software-generated bar chart used to
evaluate the isotopic distribution profile of human insulin.
RT:
2.80 - 5.56
2.8
3.0
3.2
3.4
3.6
3.8
4.0
4.2
4.4
4.6
4.8
5.0
5.2
5.4
Time (min)
0
5
10
15
20
25
30
35
40
45
50
55
60
65
70
75
80
85
90
95
100
RelativeAbundance
5.55
5.54
5.50
5.44
5.10
5.11
5.14
5.15
5.43
5.16
5.42
5.17
5.38
4.72
4.69
4.52
5.36
4.73
4.50
4.57
3.30
3.28
3.35
5.33
3.19
5.20
4.80
3.14
3.44
5.22
2.96
3.08
3.84
2.94
3.89
3.73
3.69
5.03
4.91
4.05
4.16
4.20
4.32
1155
1160
1165
1170
1175
1180
1185
1190
m/z
0
5
10
15
20
25
30
35
40
45
50
55
60
65
70
75
80
85
90
95
100
Relative Abundance
1165.3380
1172.9259
1162.3384
1156.3362
1169.9323
1180.7160
1177.5232
Apidra
Porcine
Humulin S
Glu-Lantus 960 pM base peak
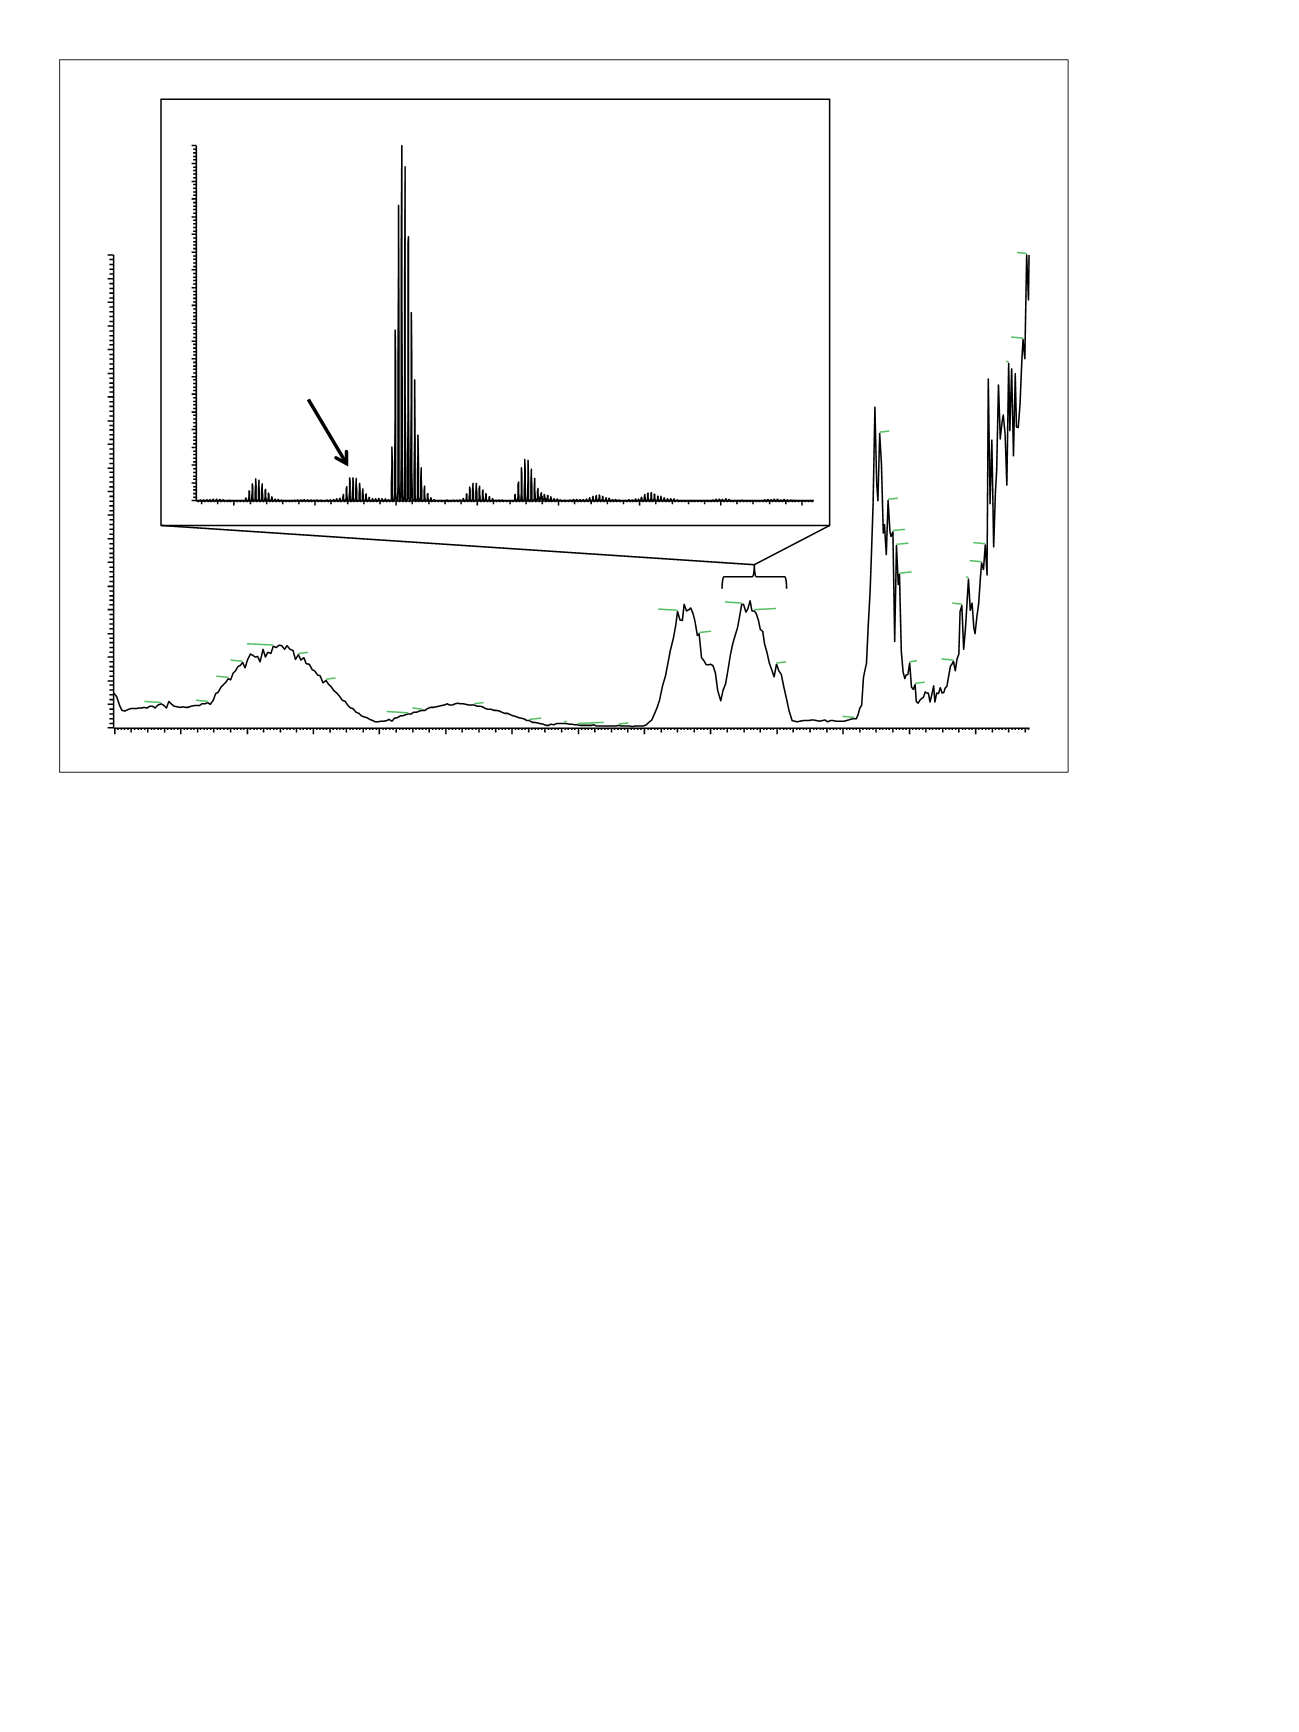
Figure 1. Base peak chromatogram for the MSIA-extracted human plasma sample spiked with 960 pM of both Apidra and Lantus
insulin variants and 50 pM of porcine insulin (internal standard). The inset shows the summed mass range covering three of the four
insulin variants.


