
6
Veri cation of the Simultaneous Analysis of Heroin Addiction Treatment Compounds Using LC/MS/MS with a New Prelude SPLC
™
System
Conclusion
All 8 compounds show excellent verification results using the Prelude SPLC
system in combination with the TSQ Vantage MS. With quality control RSD
percentages less than 10% and correlation coefficient values of 0.9924 to 0.9995,
these verification analyses are proven to be very successful.
Due to the low volume and low solvent consumption capabilities of the Prelude
SPLC system, these compounds were analyzed for research in less time, using
less solvent, and with reduced cost to a standard HPLC system
The design of the Prelude SPLC system allows for efficient online sample clean-
up that demonstrates reproducible, reliable data for all analytes, with a total
injection time that less than 6 minutes.
For research use only. Not for use in diagnostic procedures.
All trademarks are the property of Thermo Fisher Scientific and its subsidiaries. This information is not intended to
encourage use of these products in any manners that might infringe the intellectual property rights of others.
nalytes
.
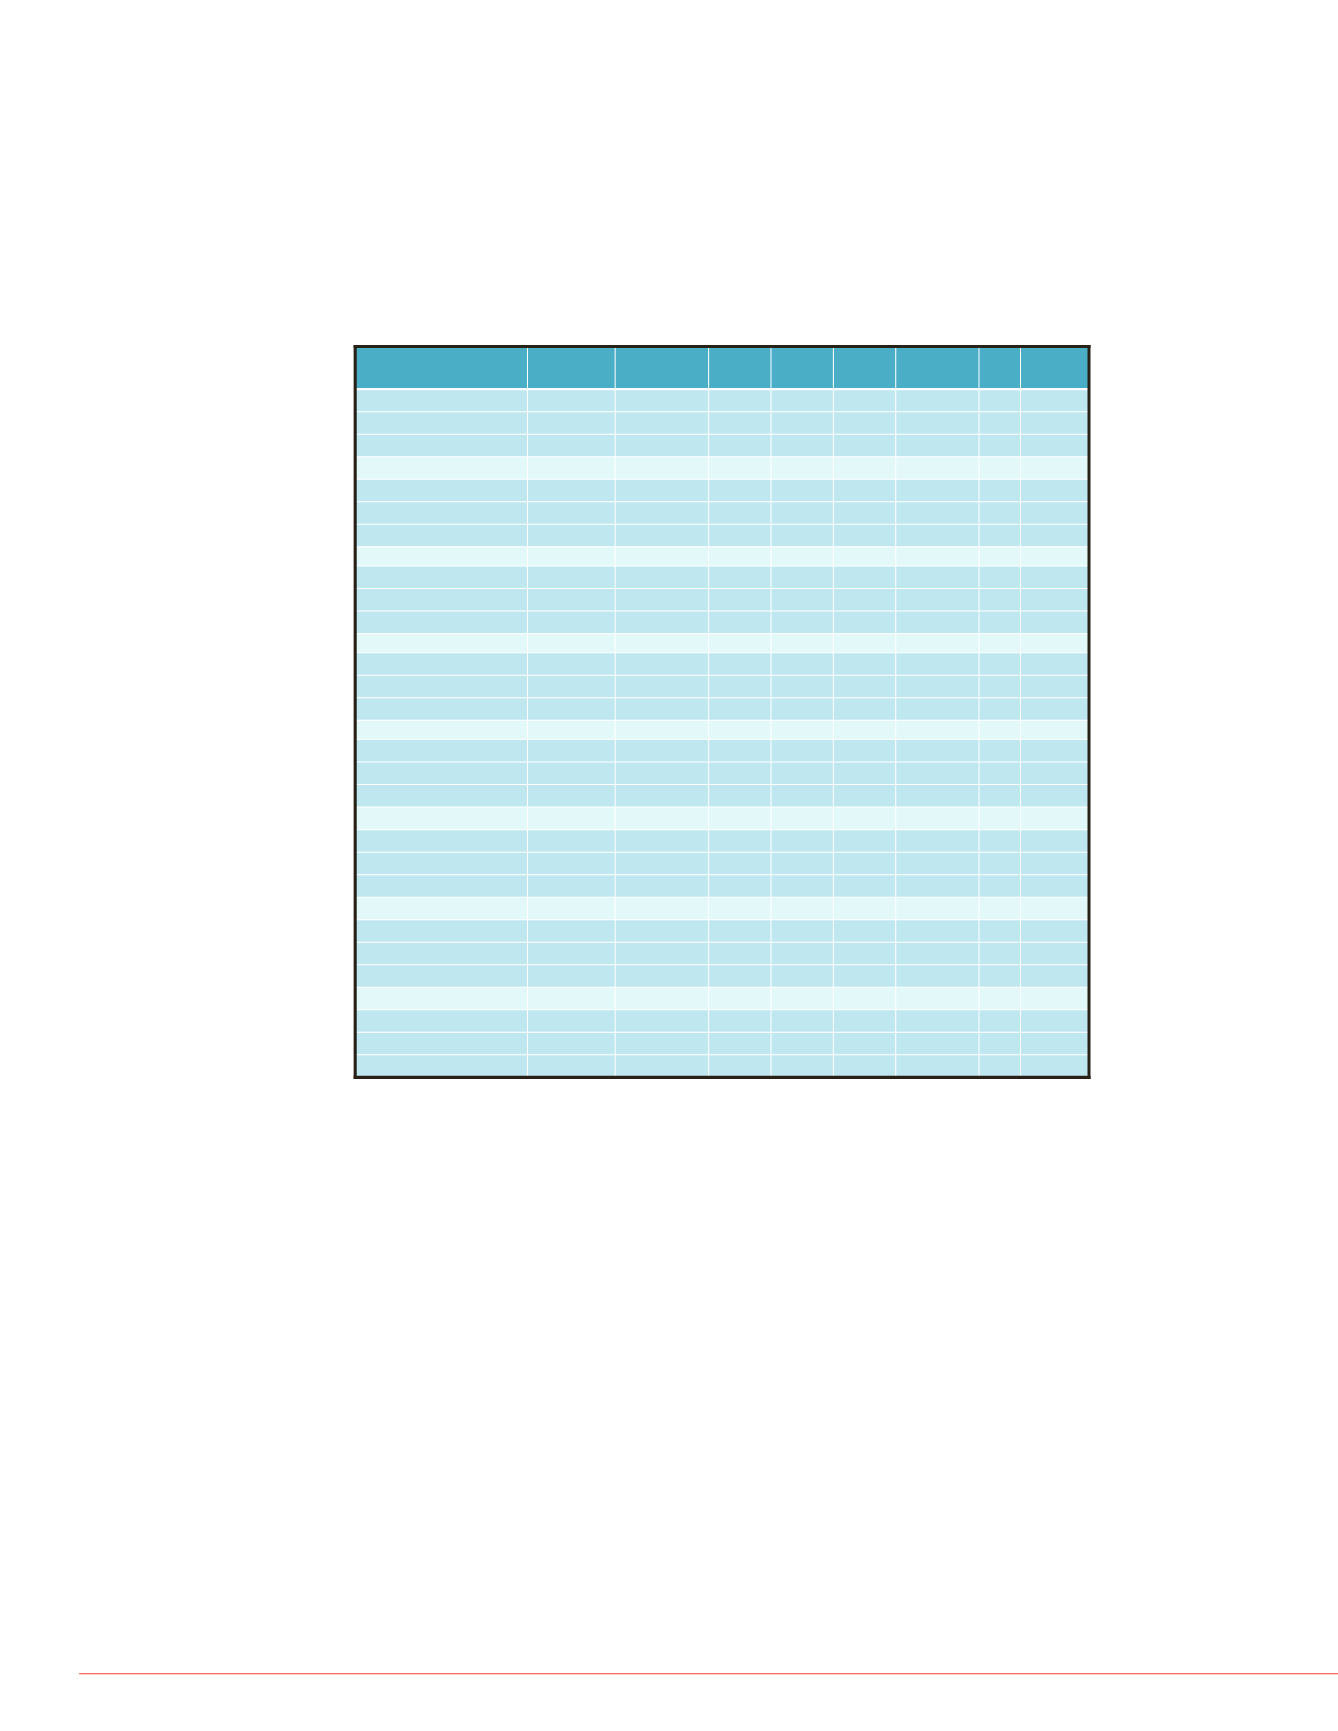
Table 3. Quality control data summary.
Table 3 shows the resulting quality control data from the interday and intraday accuracy
and precision. Three consecutive days of runs were summarized to show the ending RSD
percentages. All compounds had RSD values of ≤10% of the expected concentrations
showing excellent accuracy and precision. The third column in the table shows the
expected QC value with column 4, 5, and 6, showing the QC averages (run in replicates of
5) for each day. Then, in column 7, the overall average is calculated along with the
standard deviation (SD) in column 8. Lastly, the %RSD can be seen in column 9.
naltrexone
naloxone
hadone
EDDP
Analyte
(ng/mL) Expected Day 1 Day 2 Day 3 Average SD %RSD
buprenorphine
Low QC
3.00
3.05 2.81 2.79
3.0
0.1
3.3
Mid QC
40.0
36.4 38.7 40.0
38.0
1.8
4.7
High QC
80.0
71.0 79.3 79.8
77.0
4.9
6.4
norbuprenorphine
Low QC
3.00
2.89 3.18 3.27
3.0
0.2
6.7
Mid QC
40.0
37.4 39.1 37.8
38.0
0.9
2.4
High QC
80.0
76.5 76.6 77.6
77.0
0.6
0.8
buprenorphine
Low QC
3.00
3.31 2.88 2.86
3.0
0.3 10.0
glucuronide
Mid QC
40.0
36.3 39.4 39.5
38.0
1.8
4.7
High QC
80.0
74.3 79.8 80.9
78.0
3.5
4.5
norbuprenorphine
Low QC
3.00
2.74 3.18 3.01
3.0
0.2
6.7
glucuronide
Mid QC
40.0
37.8 38.8 38.7
38.0
0.5
1.3
High QC
80.0
77.1 76.8 79.2
78.0
1.3
1.7
methadone
Low QC
15.0
14.8 15.6 15.1
15.0
0.4
2.7
Mid QC
200
197
202
191
197
5.6
2.8
High QC
400
418
412
409
413
4.9
1.2
EDDP
Low QC
15.0
14.8 14.5 14.6
15.0
0.2
1.3
Mid QC
200
192
200
190
194
5.3
2.7
High QC
400
398
411
399
403
7.1
1.8
naloxone
Low QC
15.0
14.7 15.5 16.5
16.0
0.9
5.6
Mid QC
200
207
196
198
200
6.1
3.1
High QC
400
396
415
387
399
14.6 3.7
naltrexone
Low QC
15.0
14.7 15.4 15.2
15.0
0.4
2.7
Mid QC
200
201
192
194
195
4.8
2.5
High QC
400
383
405
382
390
12.9 3.3
the highest standard in the
f quantitation (ULOQ). This
over for each analyte. The
of the LLOQ signal. All
interest with one exception:
but this is still well within the
naltrexone
naloxone
methadone
EDDP
injected after the ULOQ.


