
3
Thermo Scientific Poster Note
•
PN ASMS13_SAMSHA_Prelude_e 06/13S
and efficient quantitative LC-MS/MS
atory analysis of 5 panel drug using
rugs were spiked with internal
d diluted.
veloped and validated to comply with
HSA/NIDA guidelines allow
perform NIDA-5 panel, urine quantitative
ds are often less complicated than the
hods because they do not require
es 6 separate quantitative methods for
s, cocaine, phencyclidine and 6-MAM to
es. Here we developed 6 methods using
analytical column, mobile phase and
are implemented on new Thermo
online sample preparation-liquid
ethod execution in parallel with a
same method on both channels
ter.
ods improves mass spectrometer
oughput and reduces analysis cost. The
volume gradient mixing used in the
LC performance including improved peak
imes and reduced solvent consumption.
curonide hydrolysis followed by dilution.
ne was spiked with 10 µL of internal
uronidase enzyme in ammonium acetate
ated at 60 °C for 2 hours. A 200-µL
sample to stop enzymatic reaction.
and diluted 20-fold with water, except
water. Then 20 µL of sample was
ormed with the Prelude SPLC system by
™ Accucore™ PFP 50x2.1mm, 2.6 µm
tained at room temperature. Mobile
monium formate with 0.1% formic acid in
ate methods were set up to analyze 6-
as set up for the combination of
, MDEA and MDMA. A final method was
ine along with hydromorphone,
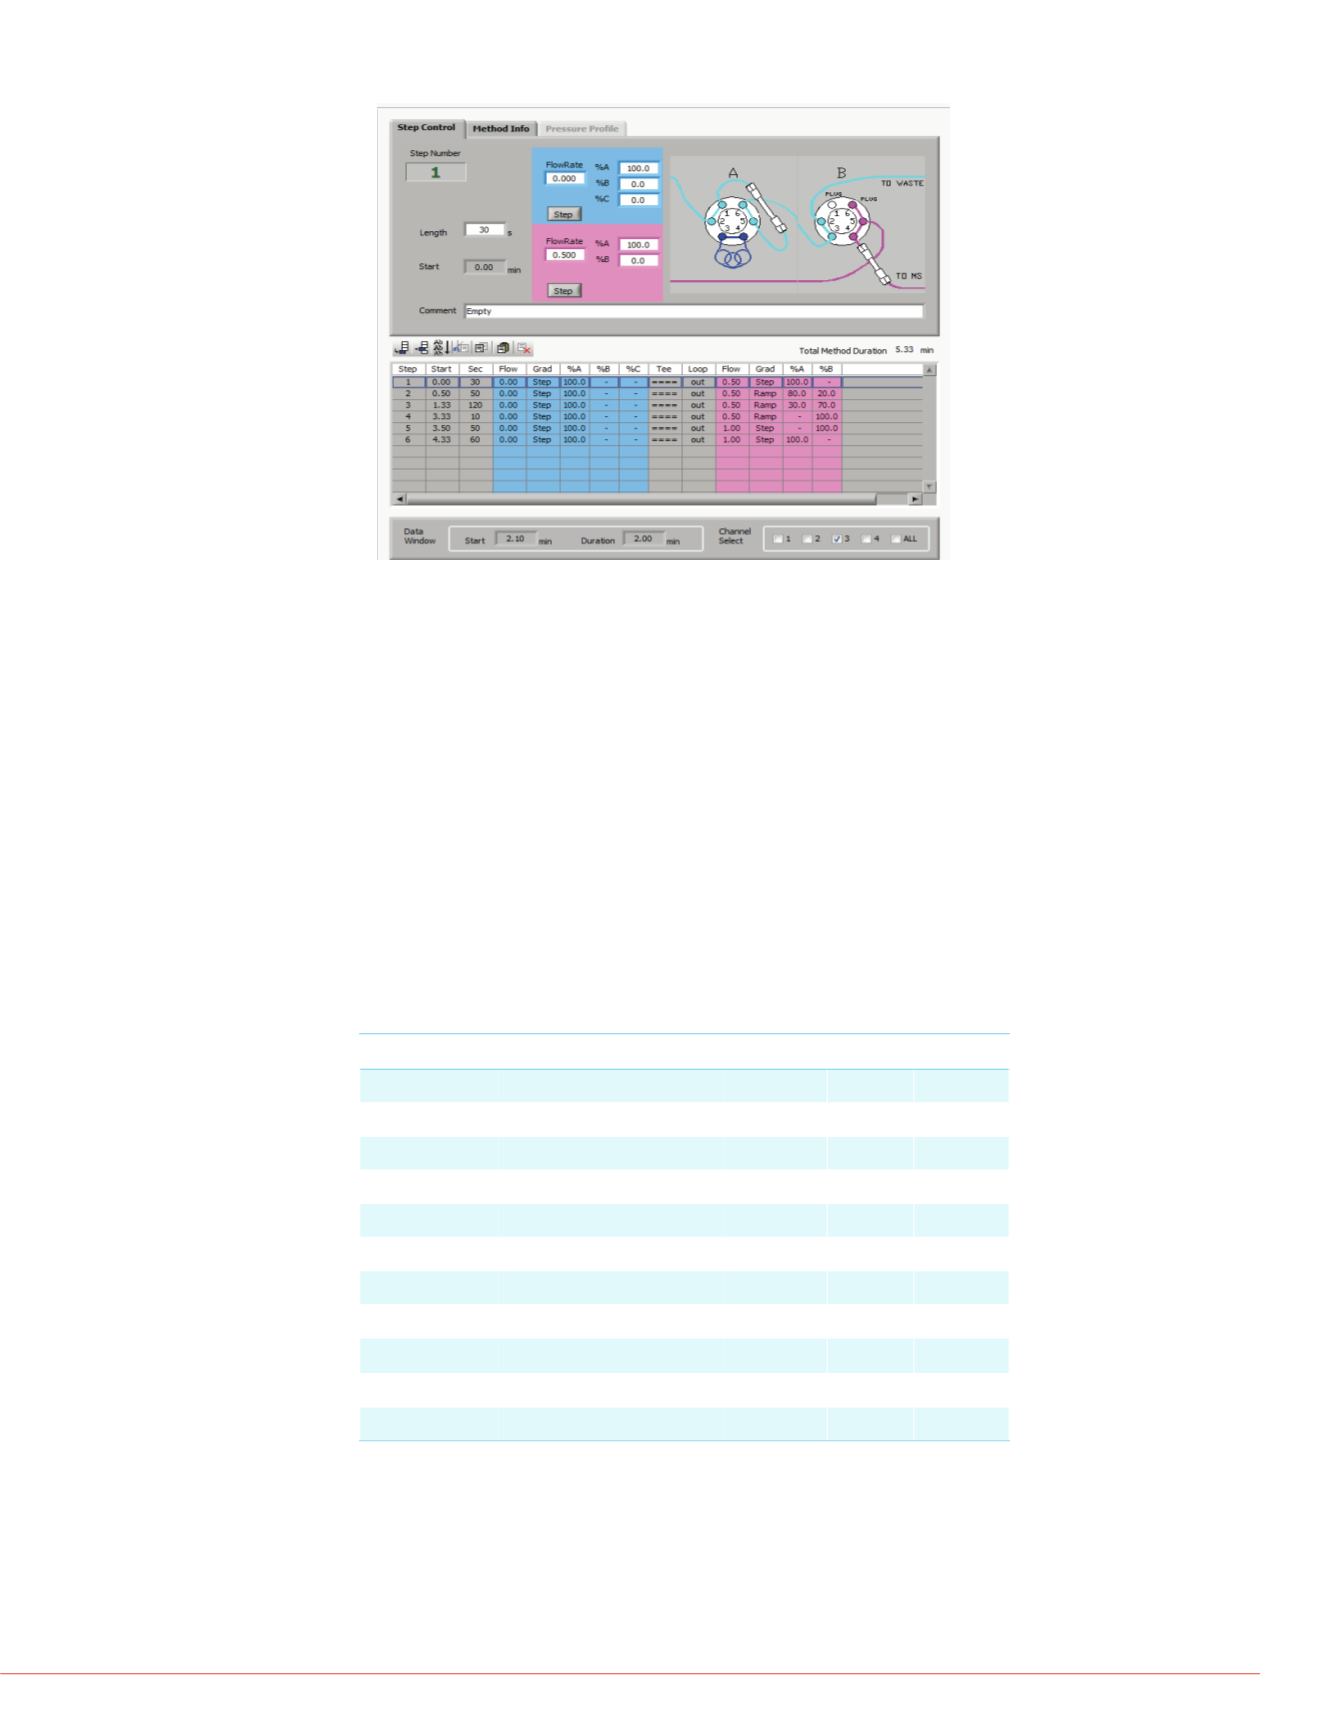
one. Figure 1 shows the LC method for
ermo Scientific™ Quantum Ultra™ triple
d with a heated electrospray ionization
h compound are listed in Table 1.
ntrol (QC) samples were prepared by
mples were processed as described in
s were validated in multiplexed mode.
accuracy were determined by analyzing a
s on three different days. Matrix effects
a of samples processed in multiple lots
Additionally for the opiates, we were
his method to those from a toxicology
re was used for data acquisition and
n ratio confirmation.
Results
For each method, performance was within SAMHSA/NIDA guidelines. The
quantitation limits (LOQ) for some compounds were lower than required to
demonstrate method capability. The linear ranges were 2.5-2000 ng/mL for
PCP and THCA; 5-2000 ng/mL for methamphetamine, BE and 6-MAM;
10-2000 ng/mL for morphine, codeine, amphetamine, MDA, and MDMA
(Figure 2). The intra-method precision was <13.5%, <3.5%, <14.1%, <6.9%, <
9.6%, <15.9% for PCP, BE, 6-MAM, THCA, opiates and amphetamines
respectively. The inter-method precision was <8.9%, <3.6%, <10.9%, <8.8%,
<7.0%, <15.3% for PCP, BE, 6-MAM, THCA, opiates and amphetamines
respectively. These results are summarized in Table 2. Limited matrix effects
were seen and those were largely mediated by deuterated internal standards.
The percent recovery for 8 spiked urine donor samples was in range of
80-120% (Table 3). Data collected for opiates with developed methods
correlated well with toxicology laboratory data with coefficient of correlation
>0.99 (Figure 4). Implementation of the dual channel Prelude SPLC system
with syringe pumps improved retention time precision, chromatographic peaks
shape and resolution, thus allowing for short, small solvent consumption LC
methods while still keeping good data quality.
FIGURE 1. LC method for separating morphine and codeine.
TABLE 1. List of NIDA 5 compounds MRM transitions, cutoff requirements,
LOQ and Linear range
FIGURE 2. Representative calibratio
PCP.
0.4 0.5 0.6 0.7 0.8 0.
0
Intensity
Oxymorphon
e
Morphine
Hy
Drug
MRM (Q: Quantifier)
Cutoff (ng/
mL)
LOQ (ng/
mL)
Linear Range
Amphetamine 136.1-91.3 (Q), 136.2-119.3
250
10
10-5000
Methamphetamine 150.2-91.2 (Q), 150.2-119.2
250
5
5-5000
MDA
180.2-135.2 (Q), 180.2-163.2 250
10
10-5000
MDMA
194.1-163.1 (Q), 194.1-135.1
250
10
10-5000
MDEA
208.1-163.1 (Q), 208.1-135.2 250
10
10-5000
Benzoylecgonine 290.1-168.1 (Q), 290.1-105.1 100
5
5-2000
THCA
354.3-336.3 (Q), 354.3-308.3
15
2.5
2.5-2000
Phencyclidine 244.2 -159.1 (Q), 290.1-105.1
25
2.5
2.5-2000
Morphine
286.11-152.1 (Q),
286.11-165.1
2000
10
10-6000
Codeine
300.2-152.1 (Q), 300.2-165.1
2000
10
10-6000
6-Acetylmorphine 328.1-165.1 (Q), 328.1-211.1
10
5
5-2000
FIGURE 3. Example chromatograms
Time (min)
00.00.10.20.30.40.50.60.70.80.
Intensit
y
PCP
0.0 0.2 0.4 0.6 0.8
0
Intensity
MDA
Amphetamin
e
Methamphe
6-MAM
0.00.10.20.30.40.50.60.70.80
Time (min)
Intensity
0
5
10
15
20
25
0 500 1000 1500 2000 250
Area Ratio
Concentration (ng/mL)
Benzoylecgonine
Y = 9.908e-3X-2.91e-3;R^2: 0.9933;
Origin:Ignore;
1/X^2;Area
0
5
10
15
20
25
0 500 1000 1500 2000 250
Area Ratio
Concentration (ng/mL)
6-MAM
Y = 1.028e-2X-1.267e-2;R^2: 0.9939;
Origin:Ignore;W:1/X^2;Area


