
4
Quantitative Confirmatory Analysis of the NIDA 5 Panel Using Prelude SPLC System and TSQ Quantum Ultra MS
ithin SAMHSA/NIDA guidelines. The
mpounds were lower than required to
linear ranges were 2.5-2000 ng/mL for
thamphetamine, BE and 6-MAM;
e, amphetamine, MDA, and MDMA
n was <13.5%, <3.5%, <14.1%, <6.9%, <
CA, opiates and amphetamines
ion was <8.9%, <3.6%, <10.9%, <8.8%,
HCA, opiates and amphetamines
arized in Table 2. Limited matrix effects
diated by deuterated internal standards.
ne donor samples was in range of
opiates with developed methods
tory data with coefficient of correlation
he dual channel Prelude SPLC system
on time precision, chromatographic peaks
or short, small solvent consumption LC
a quality.
TABLE 2. Intra-method and Inter
morphine and codeine.
MRM transitions, cutoff requirements,
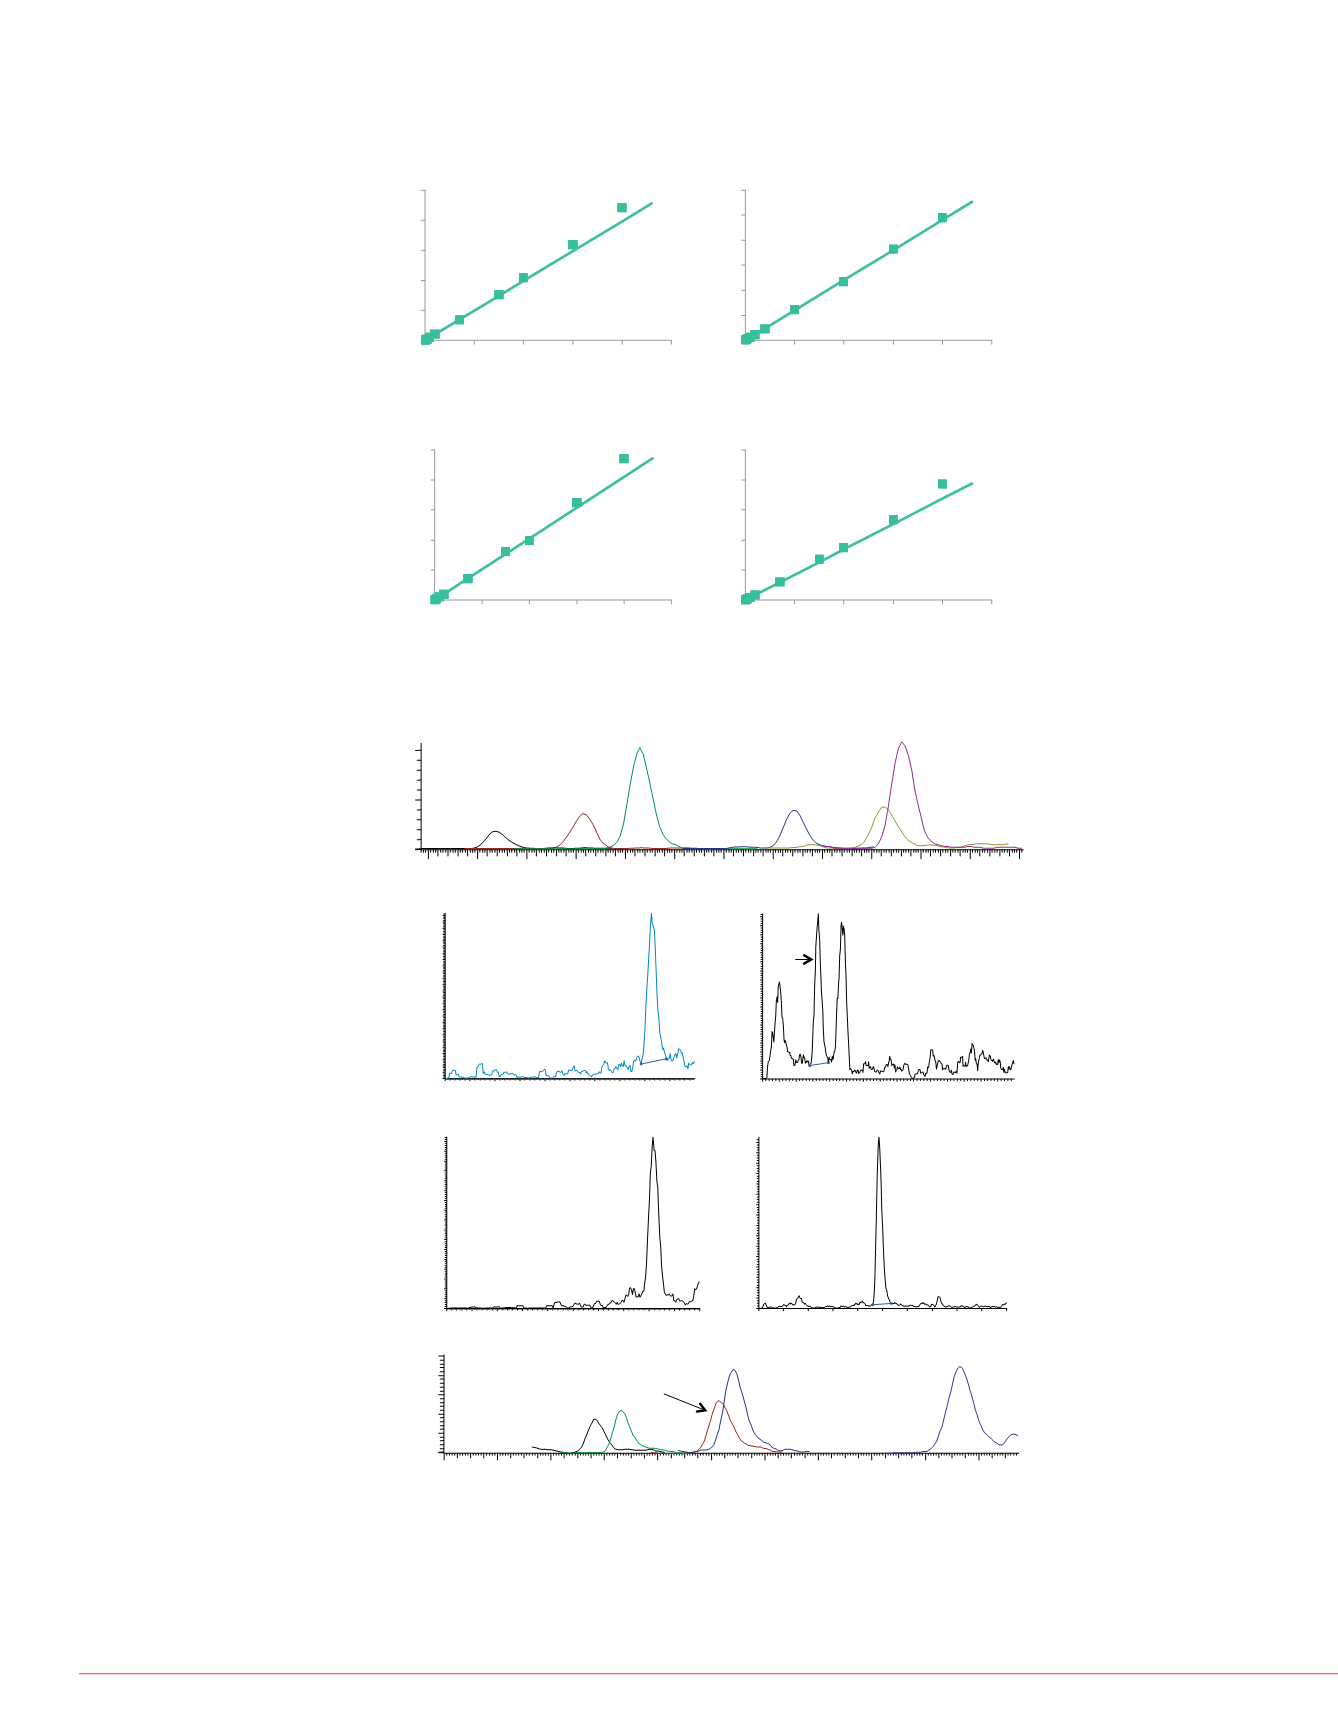
FIGURE 2. Representative calibration curves for BE, THCA, 6-MAM and
PCP.
TABLE 3. Recovery of 11 drugs i
Urine Lot
1
2
Amphetamine
100
103
MDEA
94.8
99.9
MDA
99.6
107
MDMA
101
100
Methamphetamine 99.8
101
Benzoylecgonine 106
111
Phencyclidine
88
84.2
6-Acetylmorphine 117
109
THCA
95.8
90.2
Morphine
96.1
99.8
Codeine
102
100
0.4 0.5 0.6 0.7 0.8 0.9 1.0 1.1 1.2 1.3 1.4 1.5 1.6
Time (min)
0
Intensity
Oxymorphon
e
Morphine
Codeine
Hydrocodone
Oxycodon
e
Hydromorphon
e
Compound
Intra-me
LQC
MQC
Amphetamine
<15.9 <3.6
MDEA
<5.33 <3.4
MDA
<6.66 <4.1
MDMA
<5.52 <4.3
Methamphetamine <5.47 <4.5
Benzoylecgonine <2.21 <2.3
Phencyclidine
<6.88 <3.5
6-Acetylmorphine <5.87 <3.3
THCA
<7
<2.8
Morphine
<8.2
<10.
Codeine
<7.35 <5.2
er)
Cutoff (ng/
mL)
LOQ (ng/
mL)
Linear Range
-119.3
250
10
10-5000
-119.2
250
5
5-5000
2-163.2 250
10
10-5000
1-135.1
250
10
10-5000
1-135.2 250
10
10-5000
1-105.1 100
5
5-2000
3-308.3
15
2.5
2.5-2000
.1-105.1
25
2.5
2.5-2000
),
2000
10
10-6000
2-165.1
2000
10
10-6000
1-211.1
10
5
5-2000
FIGURE 3. Example chromatograms for each method at respective LOQs.
Time (min)
00.00.10.20.30.40.50.60.70.80.9
Intensit
y
PCP
0.0 0.2 0.4 0.6 0.8 1.0 1.2 1.4 1.6 1.8 2.0
Time (min)
0
Intensity
MDEA
MDA
Amphetamin
e
MDMA
Methamphetami
ne
THCA
0.0.10.20.30.40.50.60.70.80.91.01.1.21.31.4
Time (min)
Intensity
6-MAM
0.00.10.20.30.40.50.60.70.80.91.0
Time (min)
Intensity
BE
0.00.20.40.60.81.01.21.41.61.82.0
Time (min)
Intensity
0
5
10
15
20
25
0 500 1000 1500 2000 2500
Area Ratio
Concentration (ng/mL)
Benzoylecgonine
Y = 9.908e-3X-2.91e-3;R^2: 0.9933;
Origin:Ignore;W:
1/X^2;Area
0
5
10
15
20
25
30
0 500 1000 1500 2000 2500
Area Ratio
Concentration (ng/mL)
THCA
Y = 1.204e-2X-1.232e-2;R^2: 0.9994;
Origin:Ignore;W:1/X;Area
0
5
10
15
20
25
0 500 1000 1500 2000 2500
Area Ratio
Concentration (ng/mL)
Phencyclidine
Y = 8.447e-3X-1.847e-3;R^2: 0.9916;
Origin:Ignore;W:1/X^2;Area
0
5
10
15
20
25
0 500 1000 1500 2000 2500
Area Ratio
Concentration (ng/mL)
6-MAM
Y = 1.028e-2X-1.267e-2;R^2: 0.9939;
Origin:Ignore;W:1/X^2;Area


