
4
Veri cation of the Simultaneous Analysis of Heroin Addiction Treatment Compounds Using LC/MS/MS with a New Prelude SPLC
™
System
ronide, and norbuprenorphine
o 100 ng/mL with quality control
e, EDDP, naloxone, and
0 ng/mL with quality control
d internal standards were used
titation of methadone and
loxone and naltrexone.
renorphine glucuronide, and
renorphine glucuronide. The
can be seen in Table 1.
Figure 3. Lower limit of qua
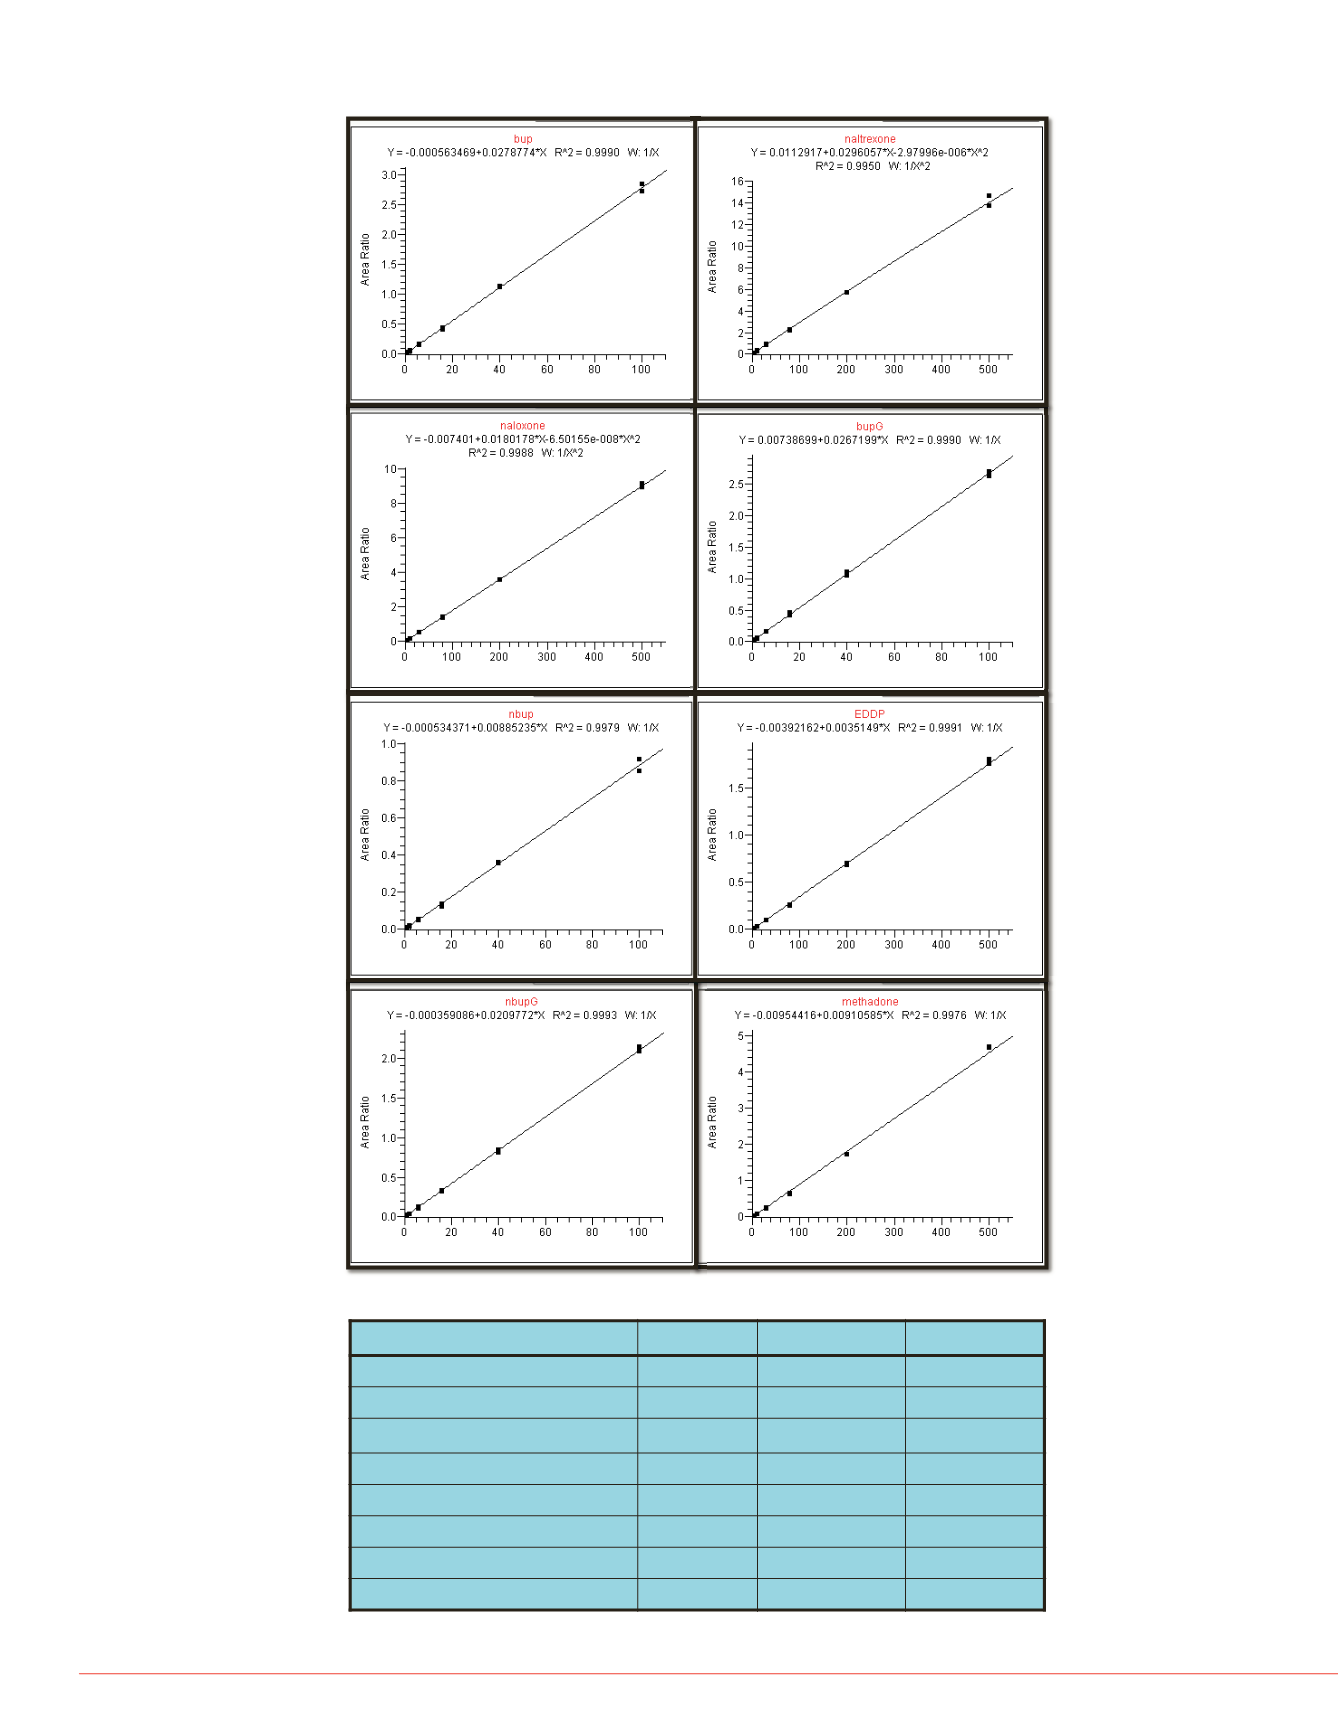
Figure 2. Calibration curve linearity for all analytes.
buprenor
glucuro
norbuprenorphine
buprenorphine
norbuprenorphine
glucuronide
Analyte
r
2
day 1
r
2
day 2
r
2
day 3
buprenorphine
0.9949
0.9976
0.9983
norbuprenorphine
0.9985
0.9969
0.9979
buprenorphine glucuronide
0.9974
0.9982
0.9990
norbuprenorphine glucuronide
0.9993
0.9993
0.9993
methadone
0.9974
0.9976
0.9994
EDDP
0.9995
0.9991
0.9986
naloxone
0.9985
0.9942
0.9988
naltrexone
0.9951
0.9924
0.9950
Table 2. Correlation coefficient values for all analytes
Figure 4 shows the matrix
calibration curve often refe
matrix blank (n=2) is used
signal in the matrix blank c
analytes have zero carryov
methadone has an averag
allowance of 20% of the L
bu
gl
norbuprenorphine
buprenorphine
norbuprenorphine
glucuronide
Figure 4. Carryover as sh
tes had linear calibration curves
illustrated in Figure 2. The x-
ch block is the area ratio of the
o the internal standard. The y-
e concentration in ng/mL.
lly, near the top of each block
lation coefficient values are
hese values are also
zed in Table 2 for easier
These r² values range from
0.9995 for all compounds.
show the lower limit of
ion (LLOQ) chromatograms for
he 8 analytes. Buprenorphine,
norphine, buprenorphine
ide, and norbuprenorphine
ide all have an LLOQ of 1.0
hile methadone, EDDP,
, and naltrexone have an LLOQ
/mL.


