
3
Thermo Scienti c Poster Note
•
PN ASMS13_M113_SFair_E 07/13S
tment of heroin addiction.
rbuprenorphine, naloxone,
rest are 2-ethylidine-1,5
ka EDDP), buprenorphine
phine glucuronide
se compounds for research
monly used in the treatment
an urine. After the addition of
Thermo Scientific™
y system. This system was
µm particle size column for
ge™ mass spectrometer in
ing the Prelude SPLC
graphy, correlation
nd analyte transitions are
of this analysis.
tment of heroin addiction.
r research using the new
low takes advantage of a low
essfully quantify methadone,
buprenorphine,
orphine glucuronide,
tment panel method
ystem to be evaluated, it
meters are designed to
workflow. These parameters
control need to be
±
20% of
e
±
15% in order for the
cutive days so that interday
ed.
may not exceed 20% of the
l diluted into a calibration
lucuronide, and
ent range of 1.0 ng/mL to
had an analytical
ntrols were also prepared in
ere diluted with a combination
hese samples are then
ormed using Prelude SPLC
3.0mm C18 analytical
es consisted of 10mM
ammonium formate, 0.05%
60% water, 40% methanol,
etonitrile, and 10% acetone
mass spectrometer with
of results was performed
Results
Analyte result summary
Buprenorphine, norbuprenorphine, buprenorphine glucuronide, and norbuprenorphine
glucuronide were all prepared at a range of 1.0 ng/mL to 100 ng/mL with quality control
concentrations at 3.0, 40.0, and 80.0 ng/mL. Methadone, EDDP, naloxone, and
naltrexone were prepared at a range of 5.0 ng/mL to 500 ng/mL with quality control
concentrations of 15.0, 200, and 500 ng/mL. Deuterated internal standards were used
for each analyte. Methadone-d9 was used for the quantitation of methadone and
EDDP. Naloxone-d5 was used for the quantitation of naloxone and naltrexone.
Buprenorphine-d4 was used for buprenorphine and buprenorphine glucuronide, and
norbuprenorphine-d3 for norbuprenorphine and norbuprenorphine glucuronide. The
transitions used for the analytes and internal standards can be seen in Table 1.
Figure 2. Calibration curve
Analyte
buprenorphine
norbuprenorphine
buprenorphine glucuronide
norbuprenorphine glucuroni
methadone
EDDP
naloxone
naltrexone
Table 2. Correlation coeffici
Compound
Transition
methadone
310→265
EDDP
278→219
naloxone
328→212
naltrexone
342→270
buprenorphine
468→396
norbuprenorphine
414→187
buprenorphine
glucuronide
644→468
norbuprenorphine
glucuronide
590→414
methadone-d9
319→268
naloxone-d5
333→212
buprenorphine-d4
472→400
norbuprenorphine-d3
417→187
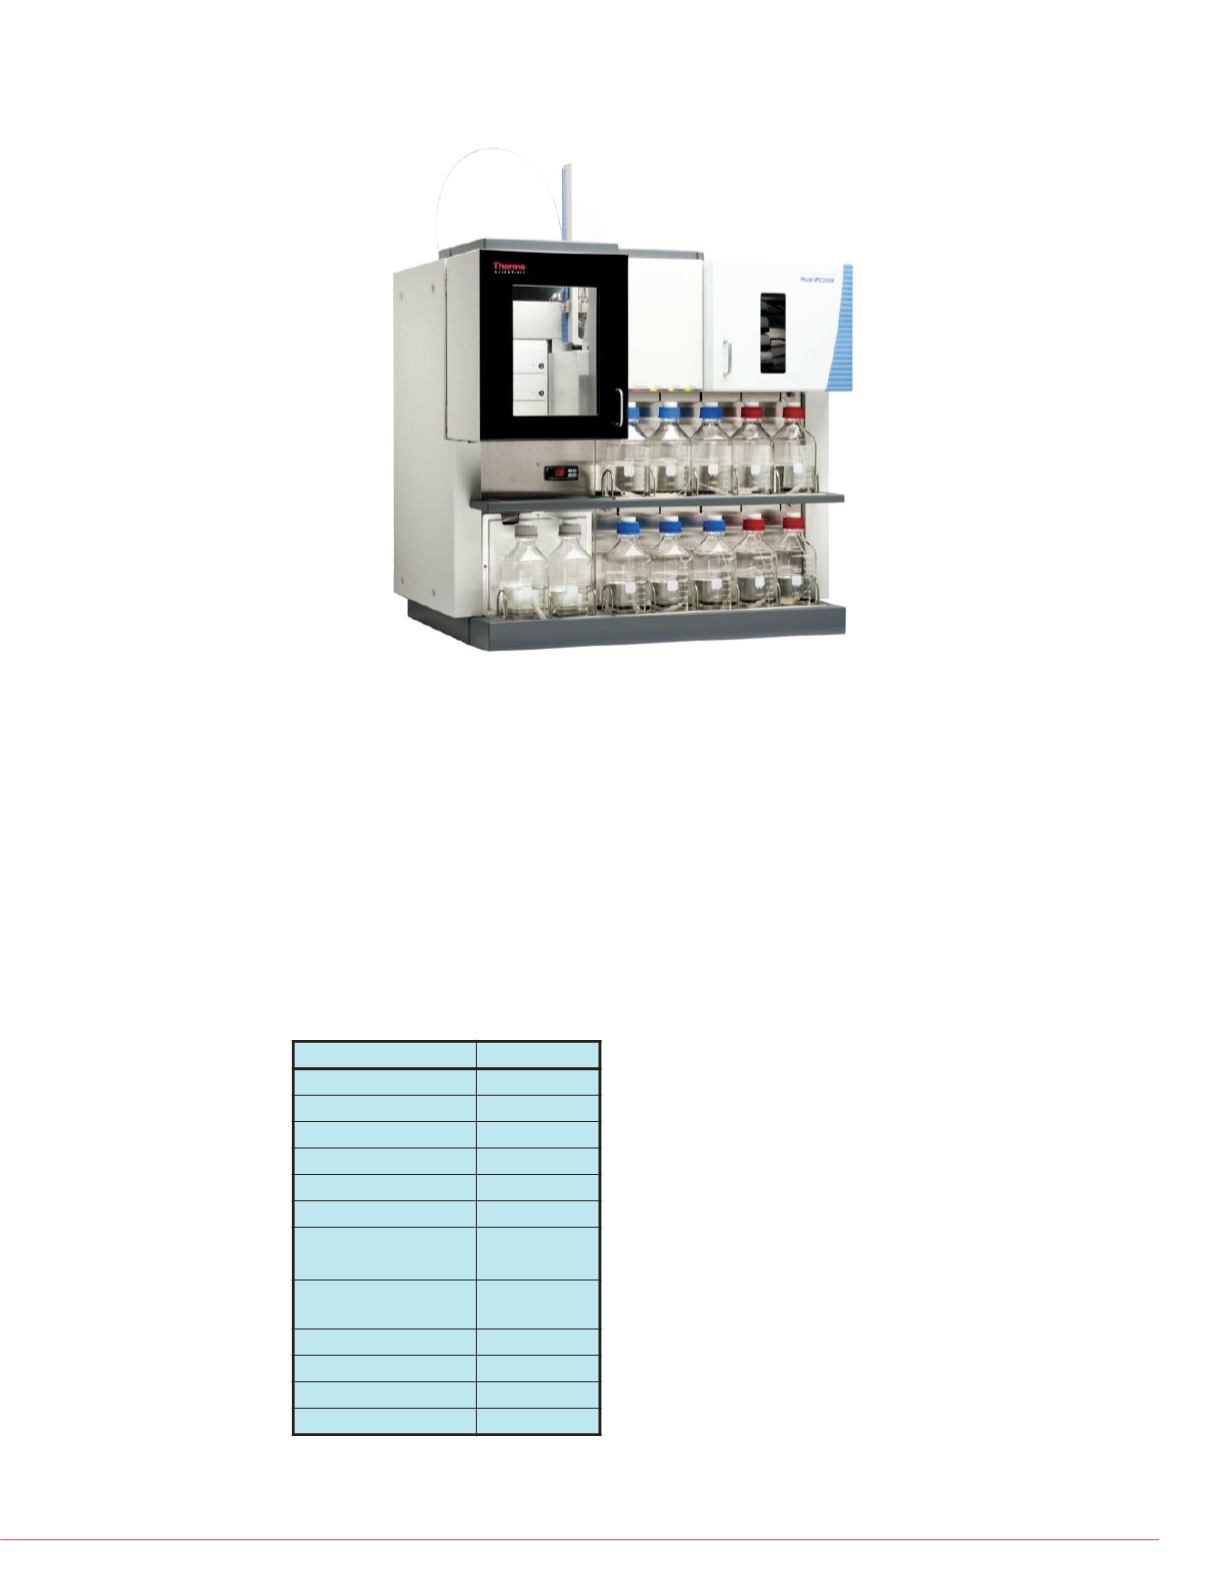
FIGURE 1. Prelude SPLC system
All analytes had linear calibration curves
which are illustrated in Figure 2. The x-
axis of each block is the area ratio of the
analyte to the internal standard. The y-
axis is the concentration in ng/mL.
Additionally, near the top of each block
the correlation coefficient values are
posted. These values are also
summarized in Table 2 for easier
viewing. These r² values range from
0.9924 to 0.9995 for all compounds.
Figure 3 show the lower limit of
quantitation (LLOQ) chromatograms for
each of the 8 analytes. Buprenorphine,
norbuprenorphine, buprenorphine
glucuronide, and norbuprenorphine
glucuronide all have an LLOQ of 1.0
ng/mL while methadone, EDDP,
naloxone, and naltrexone have an LLOQ
of 5.0 ng/mL.
Table 1. Analyte Transitions


