


 273 / 658

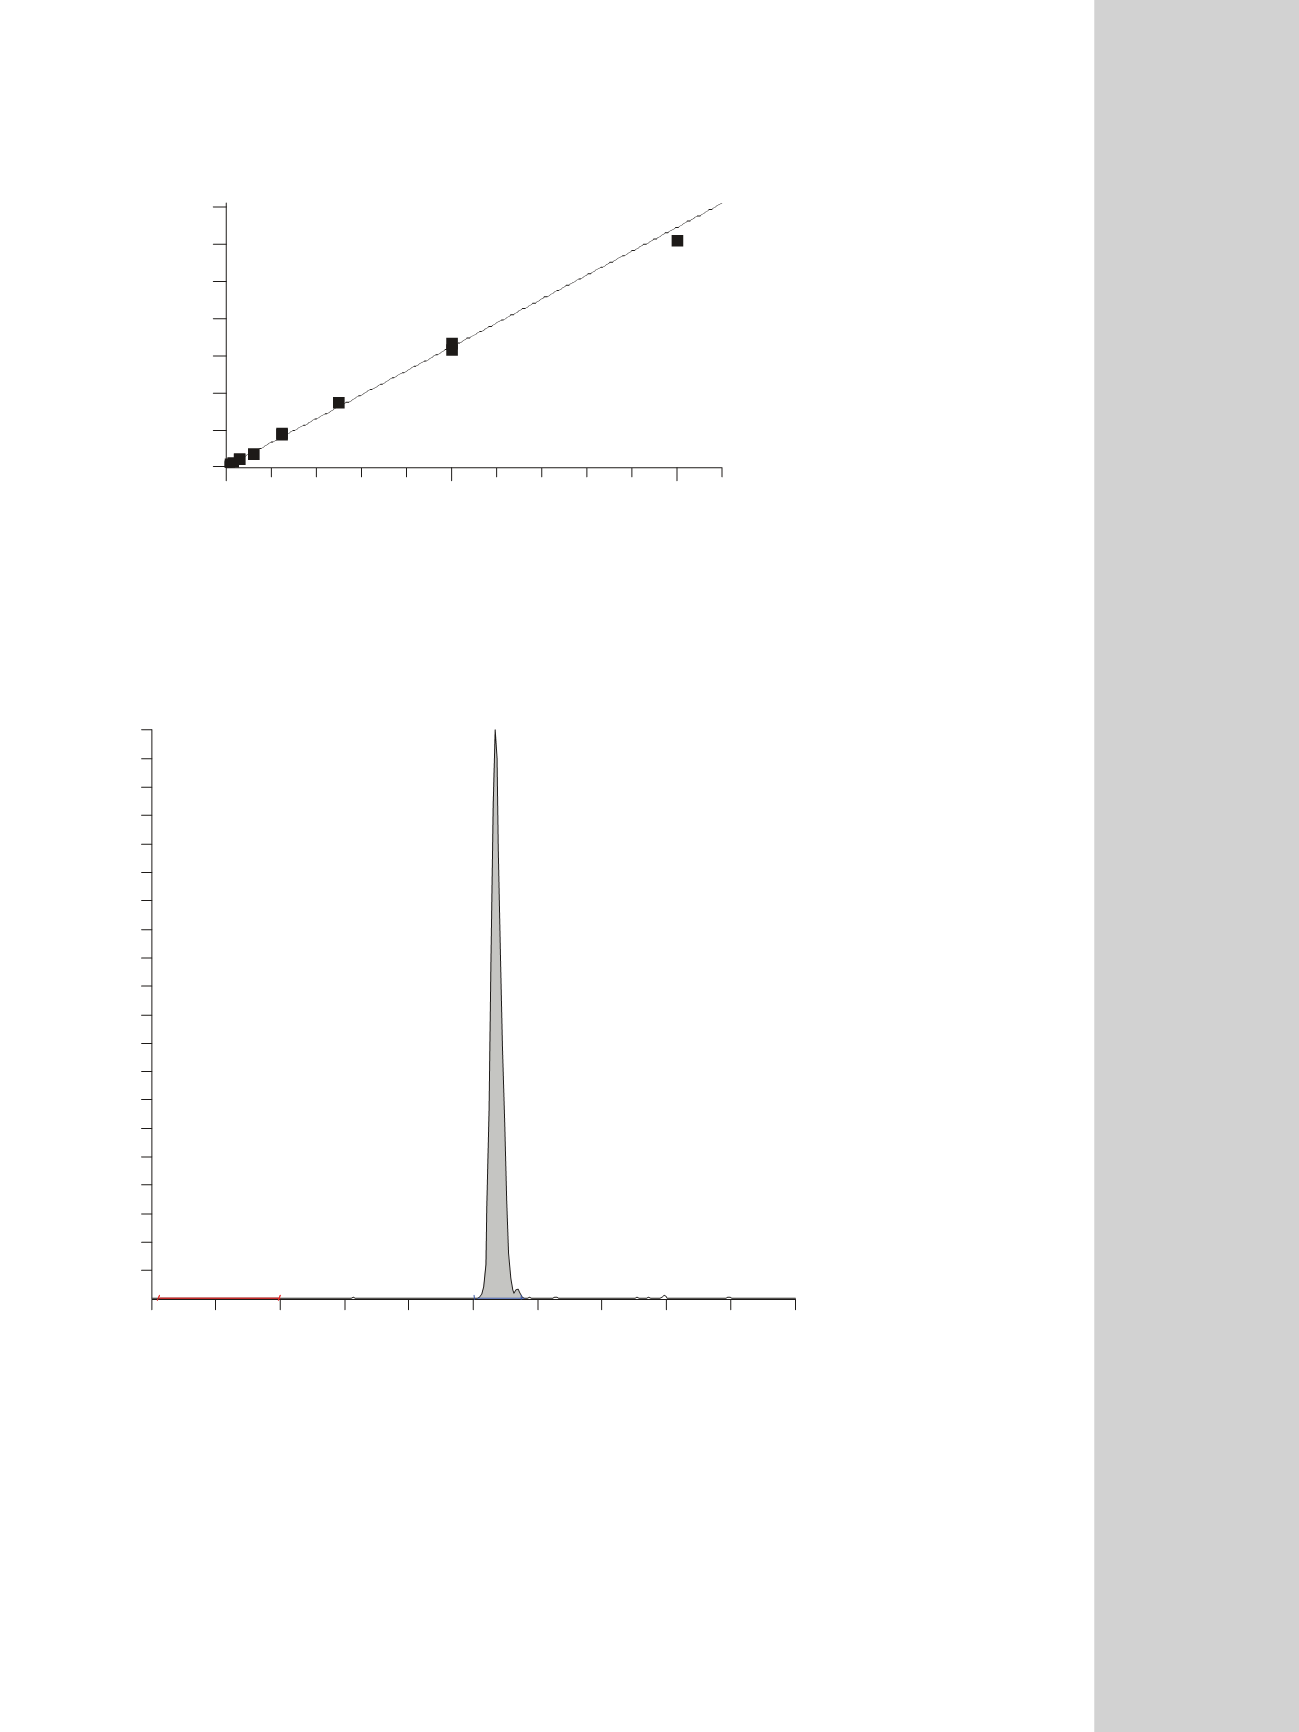
Y = 1368.24+1286.83*X R^2 = 0.9955 W : 1/X
0
500
1000
ng /mL
0
200000
400000
600000
800000
1000000
1200000
1400000
Area
THC-COOH_neg
Figure 3. Calibration curve of THC-COOH in negative ionization mode
RT:
2.00 - 4.00
SM:
3G
2.0
2.2
2.4
2.6
2.8
3.0
3.2
3.4
3.6
3.8
4.0
Time (min)
5
10
15
20
25
30
35
40
45
50
55
60
65
70
75
80
85
90
95
100
THC-COOH neg
RT: 3.07
Figure 4. Ion chromatogram of urine sample containing 225 ng/mL. Sample was hydrolyzed and diluted 1:10 before the analysis.
[M-H] -