
286.9
287.0
287.1
287.2
287.3
m/z
0
5
10
15
20
25
30
35
40
45
50
55
60
65
70
75
80
85
90
95
100
Relative Abundance
287.22174
287.08087
287.20474
287.10028
287.23709
287.16766
287.05829
287.27325
286.95816
Oxazepam
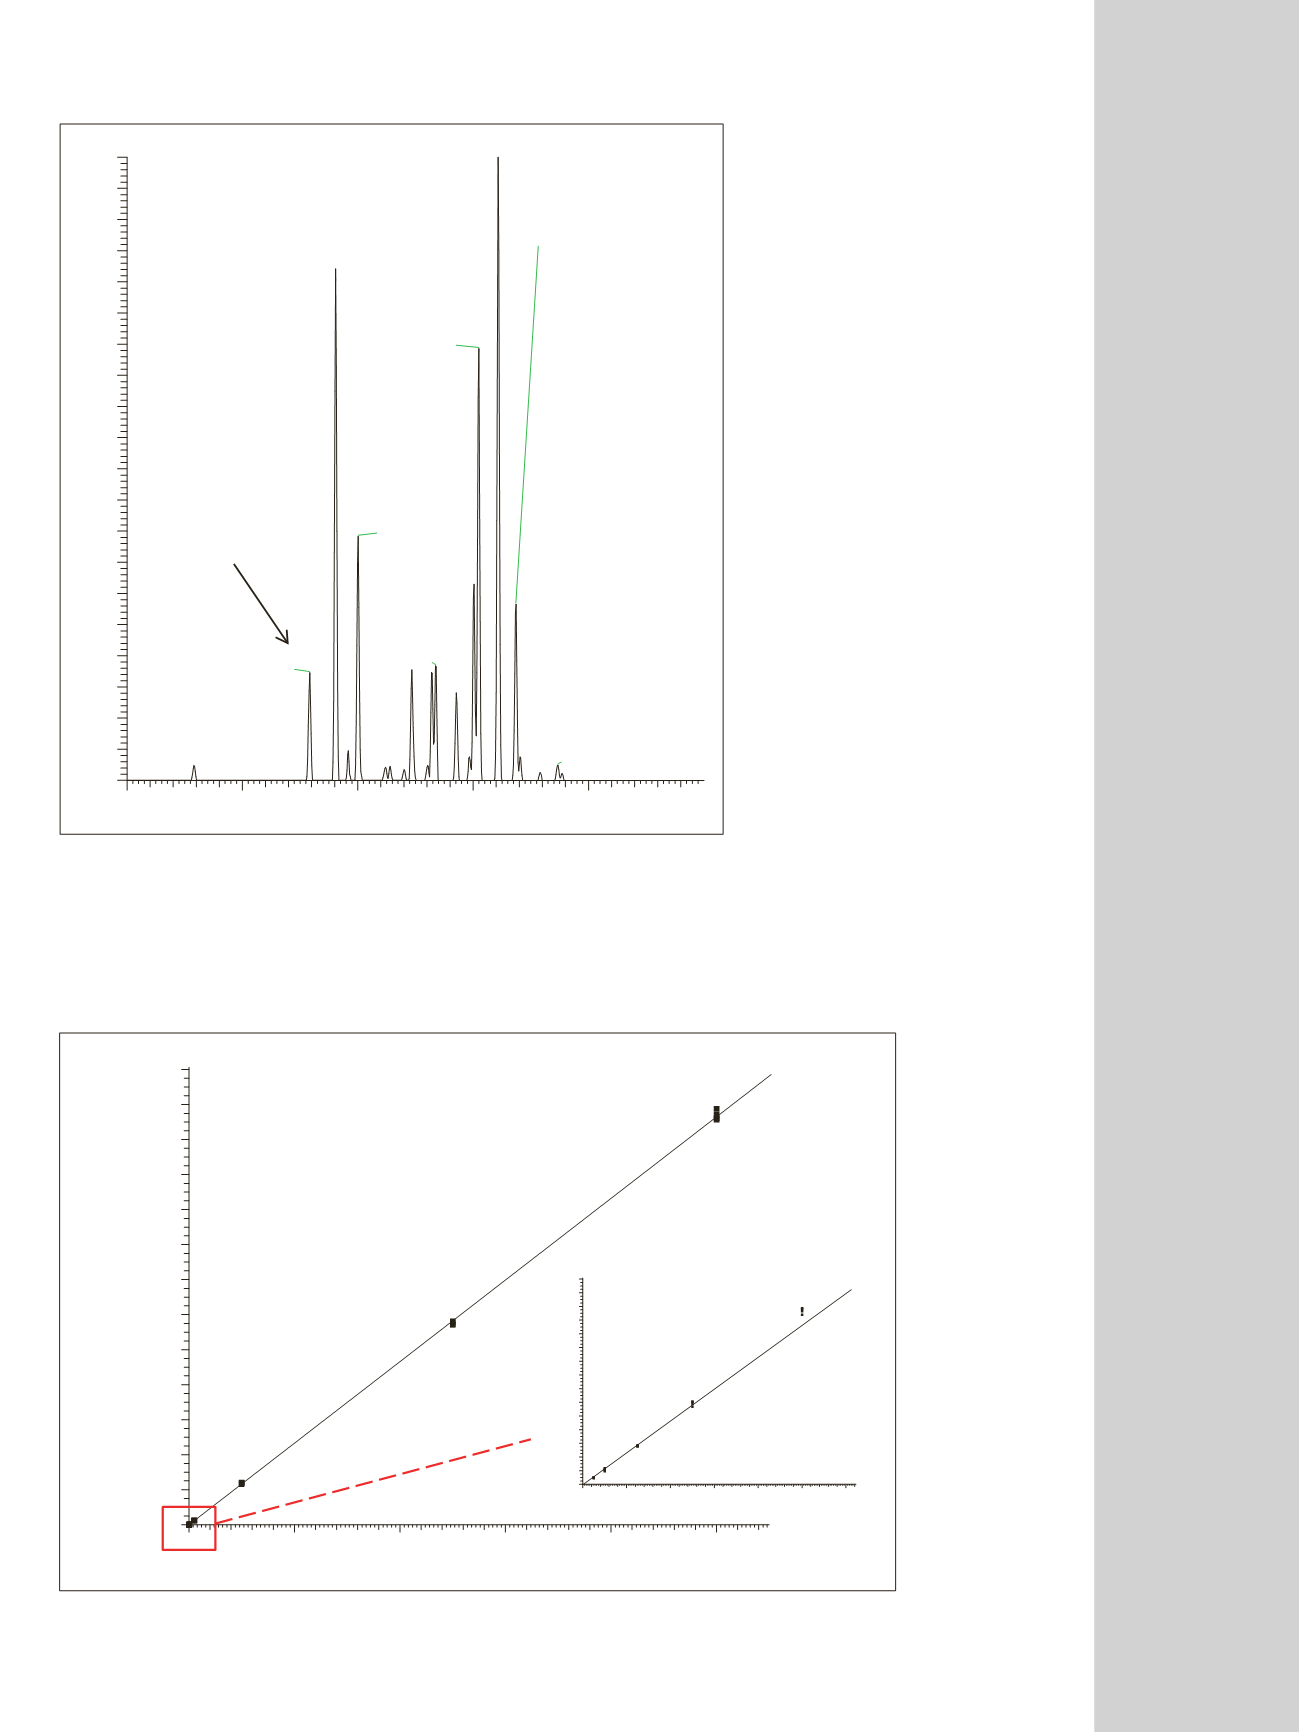
Figure 3. SIM spectrum of oxazepam in urine at mass resolution of 140,000 FWHM
Figure 4 and Table 2 demonstrate the overall
quantitative performance of the Q Exactive mass
spectrometer for diazepam in urine. The calibration
curve for diazepam in Figure 4 shows a linear dynamic
range of over four decades (0.0125 – 250 ng/mL),
including the inset from 0.0125 to 0.25 ng/mL, with
Figure 4
Diazepam
Y = -600.05+932195*X R^2 = 0.9998 W: 1/X
0
50
100
150
200
250
ng/mL
20000000
40000000
60000000
80000000
100000000
120000000
140000000
160000000
180000000
200000000
220000000
240000000
260000000
Area
Diazepam
Y = -600.05+932195*X R^2 = 0.9998 W: 1/X
0.00 0.05 0.10 0.15 0.20 0.25 0.30
ng/mL
20000
60000
100000
140000
180000
220000
260000
300000
Area
Figure 4. Calibration curve for diazepam in urine from 0.0125 – 250 ng/mL


