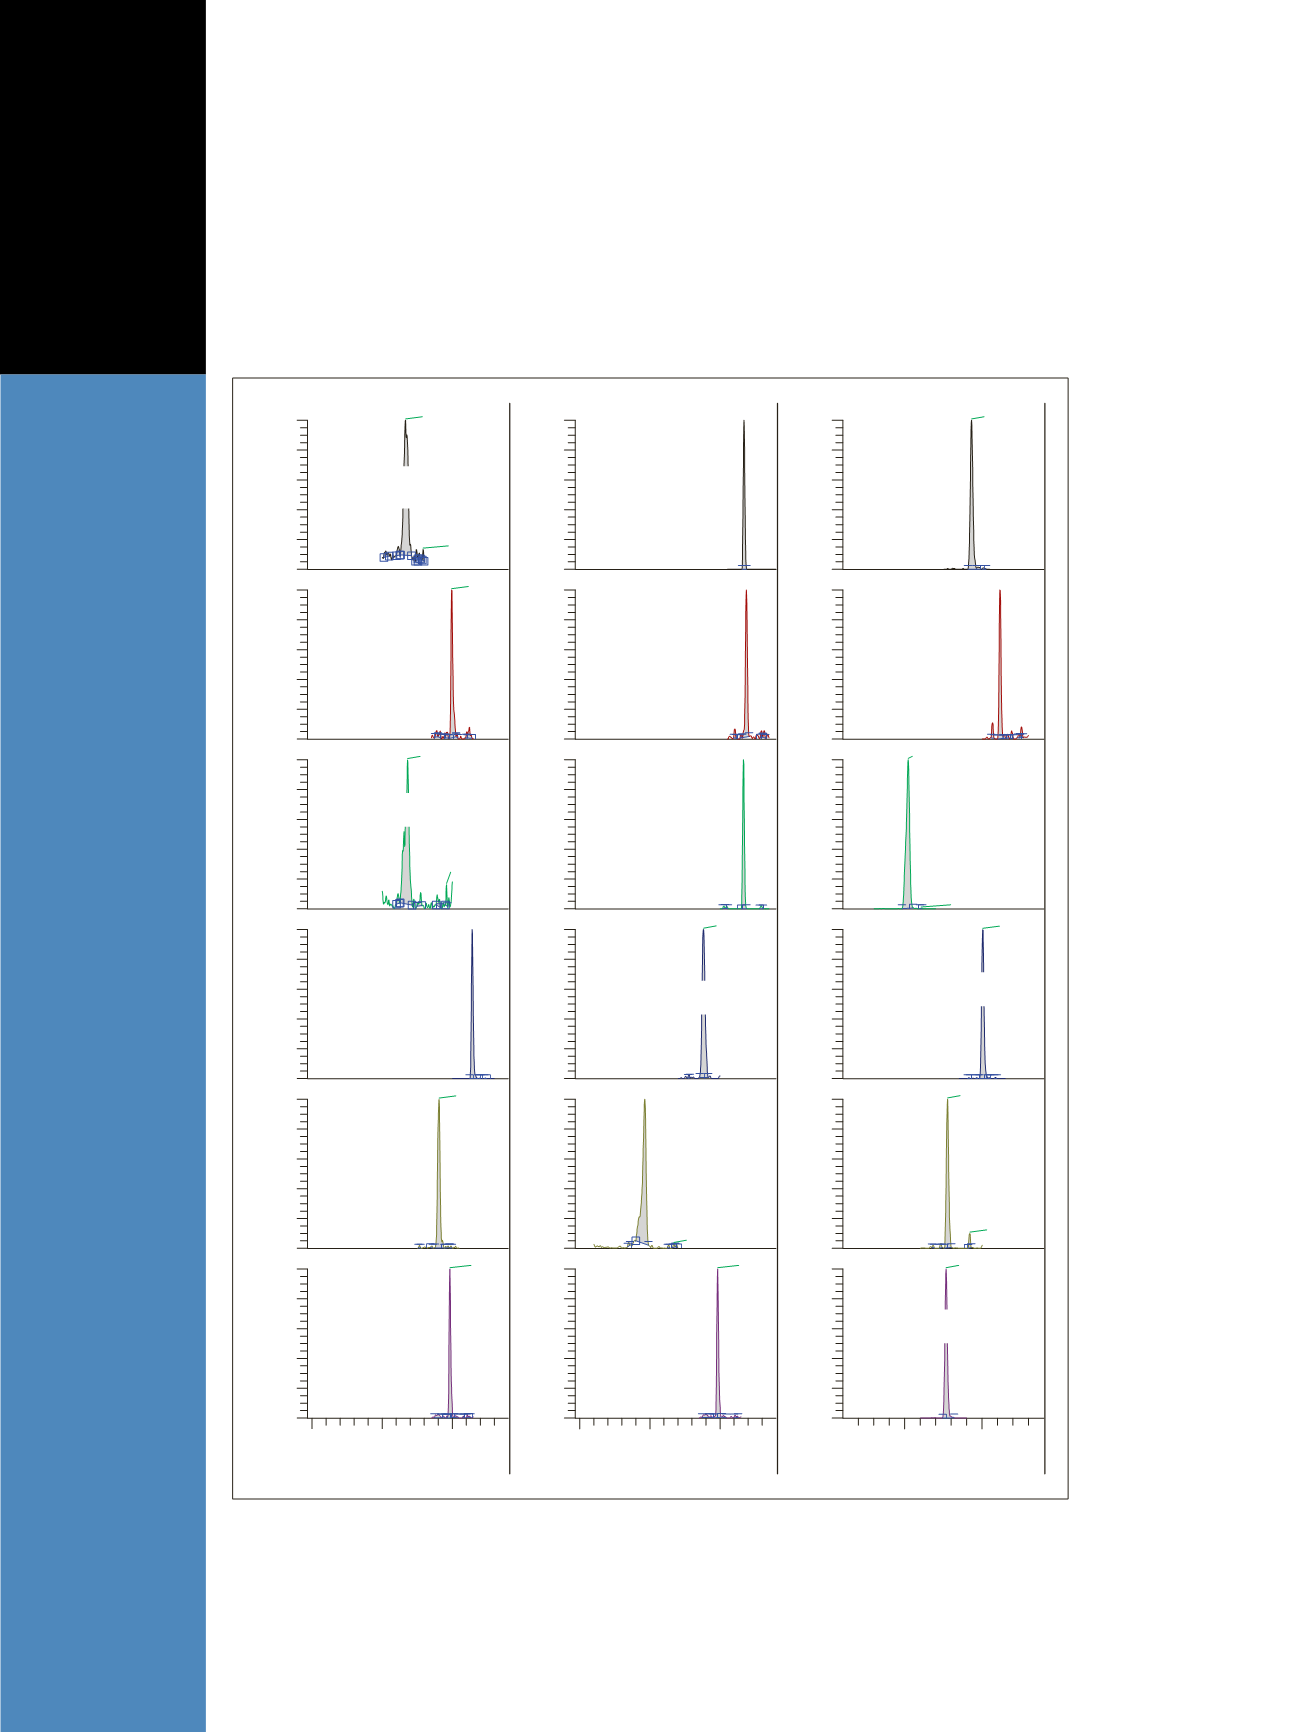

Figure 1. Representative chromatograms for the methods at the low end of the calibration curve
Results and Discussion
For each analyte, linearity and quantitative results were
obtained using SRM transitions. Quantitation of the
18 drugs was performed with a calibration range of
5 to 500 ng/mL for 5 compounds, 10 to 1000 ng/mL for
9 compounds, 2 to 200 ng/mL for 3 compounds, and
1 to 100 ng/mL for 1 compound. The R
2
value for
each of the calibration curves was above 0.998, which
indicates an excellent linear fit over the dynamic
range. Figure 1 shows the chromatogram of the lowest
calibration standard. Calibration curves for risperidone
and clozapine are reported in Figure 2. Table 1 displays
the calibration ranges and method precision for all
analyzed drugs.
2
3
4
0
20
40
60
80
100
0
20
40
60
80
100
0
20
40
60
80
100
0
20
40
60
80
100
Relative Abundance
0
20
40
60
80
100
0
20
40
60
80
100
RT:3.33
RT:3.58
RT:3.99
RT :3.36
RT:3.92
R T : 3.8 1
RT:3.97
2
3
4
Time (min)
Time (min)
Time (min)
0
20
40
60
80
100
0
20
40
60
80
100
0
20
40
60
80
100
0
20
40
60
80
100
Relative Abundance
0
20
40
60
80
100
0
20
40
60
80
100
RT:3.76
RT:2.93
R T : 3.3 4
RT:3.97
3
4
0
20
40
60
80
100
0
20
40
60
80
100
0
20
40
60
80
100
0
20
40
60
80
100
Relative Abundance
0
20
40
60
80
100
0
20
40
60
80
100
RT:3.86
RT:3.05
RT:3.21
RT:4.01
RT: 3.55
RT:3.84
RT: 3.53
O-Desmethyl-
Venlafaxine
Norfluoxetine
Mianserine
Sertraline
Paroxetine
Clozapine
Mirtazapine
Venlafaxine
Maprotiline
Fluoxetine
Citalopram
Olanzapine
Norclozapine
Desmethyl
Sertraline
9-OH-Risperidone
Risperidone
Quetiapine
Amisulpride
Figure 1
: Rep re s en ta tiv e c h rom a tog rams fo r the as s ay s a t the low end o f the
calibration curve


