
Table 1
Compound
SIM Time
Window (min)
Exact
m/z
Measured
m/z
Error
(ppm )
LLOQ
(ng /mL )
Oxazepam
0.00-3.45
287.05818
287.05829
+0.4
0.0625
Lorazepam
0.00-3.65
321.01921
321.01926
+0.2
0.1250
Nitrazepam
0.00-3.65
282.08732
282.08746
+0.5
0.0625
Clonazepam
0.00-3.85
316.04835
316.04828
-0.2
0.0625
Temazepam
3.45-6.00
301.07383
301.07410
+0.9
0.0250
Flunitrazepam
3.65-6.00
314.09355
314.09296
-1.9
0.0625
Alprazolam
3.65-6.00
309.09015
309.09024
+0.3
0.0125
Diazepam
3.85-6.00
285.07892
285.07901
+0.3
0.0125
Table 1. List of benzodiazepines quantified by HRAM LC/MS on the Q Exactive mass spectrometer
Figure 2
2.0
2.5
3.0
3.5
4.0
4.5
5.0
5.5
Time (min)
100
100
100
100
100
Relative Abundance
100
100
100
RT: 3.21
AA: 11543
RT: 3.35
AA: 8170
RT: 3.37
AA: 15132
RT: 3.62
AA: 12952
RT: 3.72
AA: 44838
RT: 3.94
AA: 33079
RT: 3.98
AA: 108781
RT: 4.12
AA: 114810
Oxazepam
Lorazepam
Nitrazepam
Clonazepam
Temazepam
Flunitrazepam
Alprazolam
Diazepam
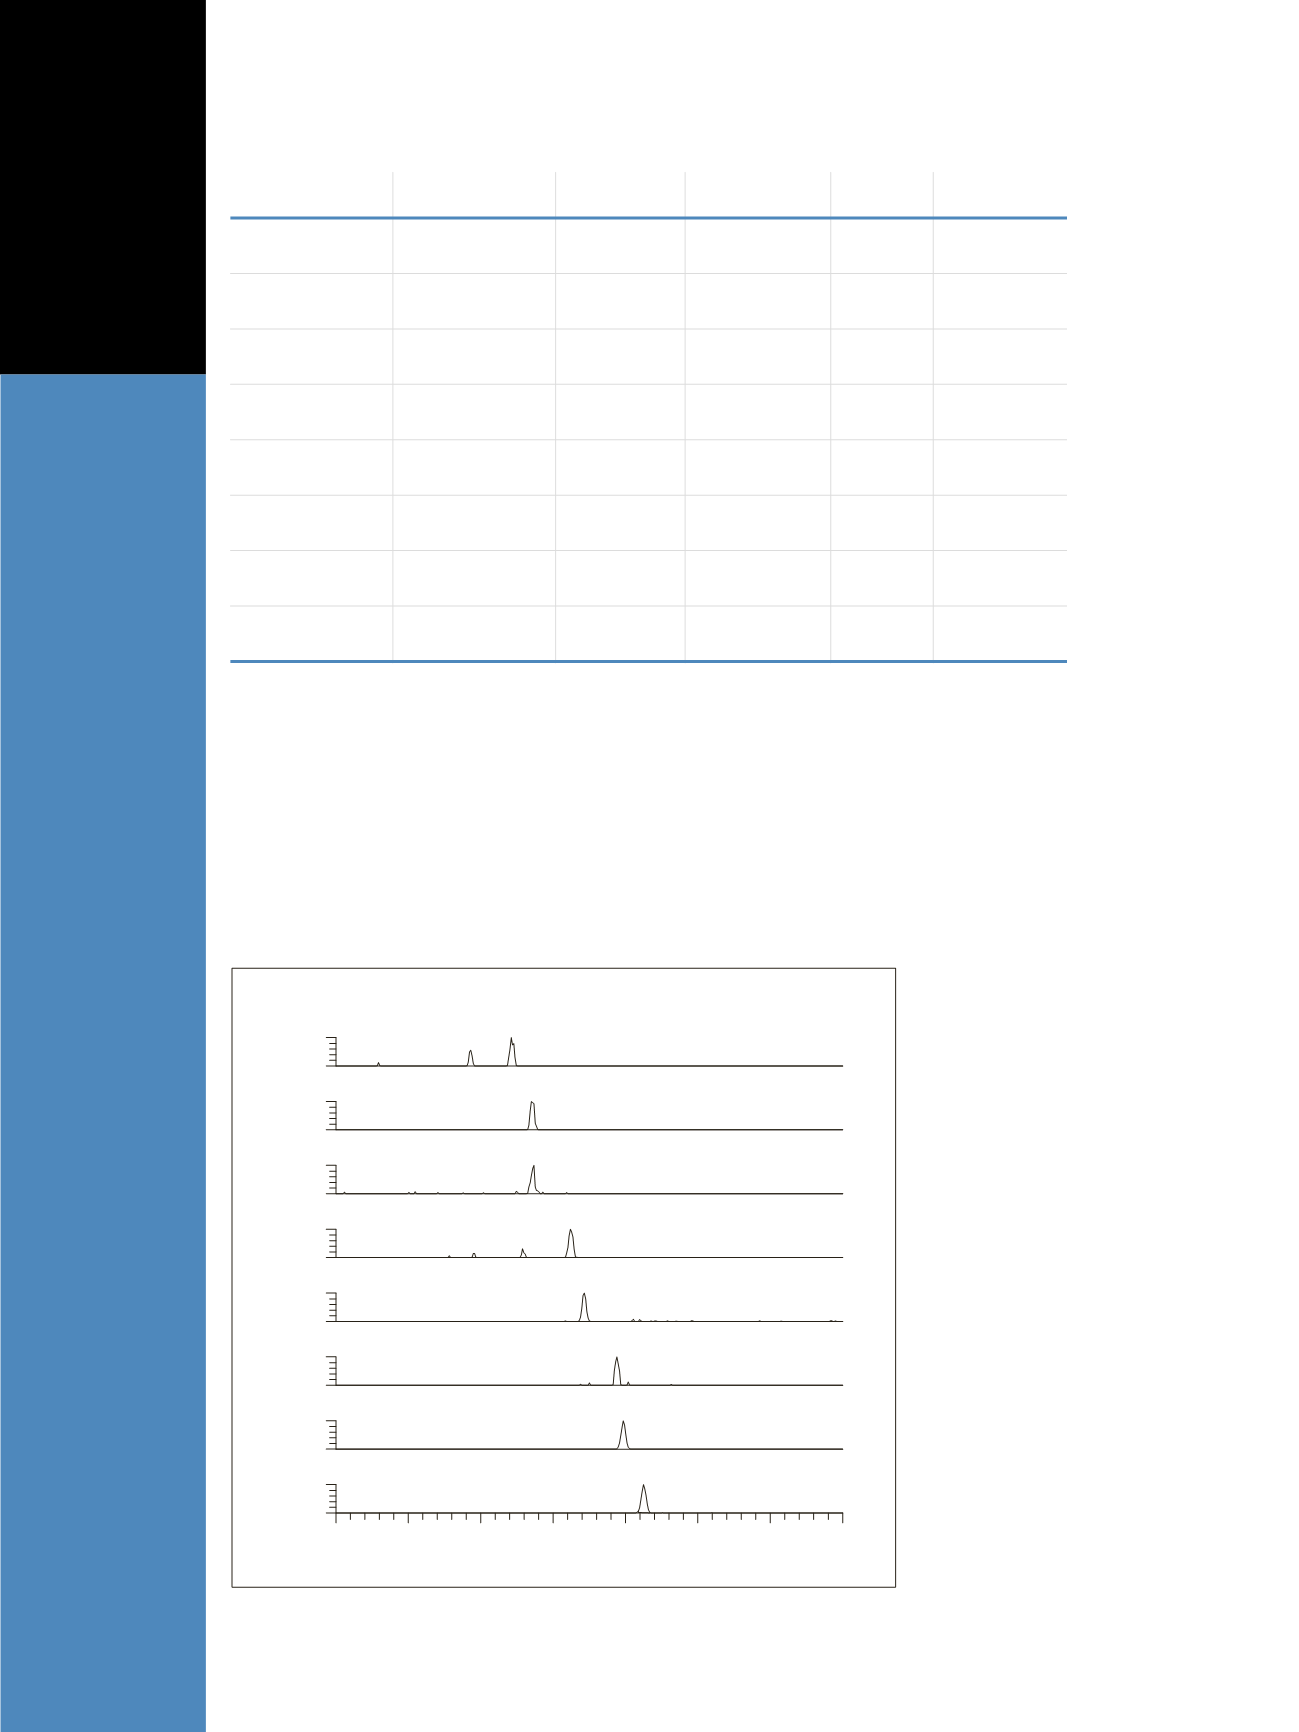
Figure 2. Extracted ion chromatograms (5 ppm) for 0.125 ng/mL benzodiazepines in urine
Figure 2 presents an example LC/MS analysis
of benzodiazepines at 0.125 ng/mL in urine using
multiplexed SIM on the Q Exactive mass spectrometer.
By acquiring these data at a mass resolution of 140,000
FWHM, little or no chemical noise is observed for
the ± 5 ppm extracted ion chromatograms of the
benzodiazepines in urine. The selectivity afforded by
the Q Exactive mass spectrometer at a resolution of
140,000 FWHM is illustrated in the SIM spectrum for
oxazepam (Figure 3). In addition to the oxazepam ion at
m/z
287.05829, there are at least 12 other ions observed
within a 0.25
m/z
range. Yet, the oxazepam ion is easily
separated from the other chemical interference ions
with the high resolving power of the Q Exactive mass
spectrometer.


