
6.5
7.0
7.5
8.0
8.5
9.0
9.5
Time (min)
0
20
40
60
80
100
RelativeAbundance
0
RelativeAbundance
0
20
40
60
80
100
RelativeAbundance
JWH-073-OH
1
2
3
4
5
6
7
8
JWH-018-OH
JWH-073-COOH
JWH-018-COOH
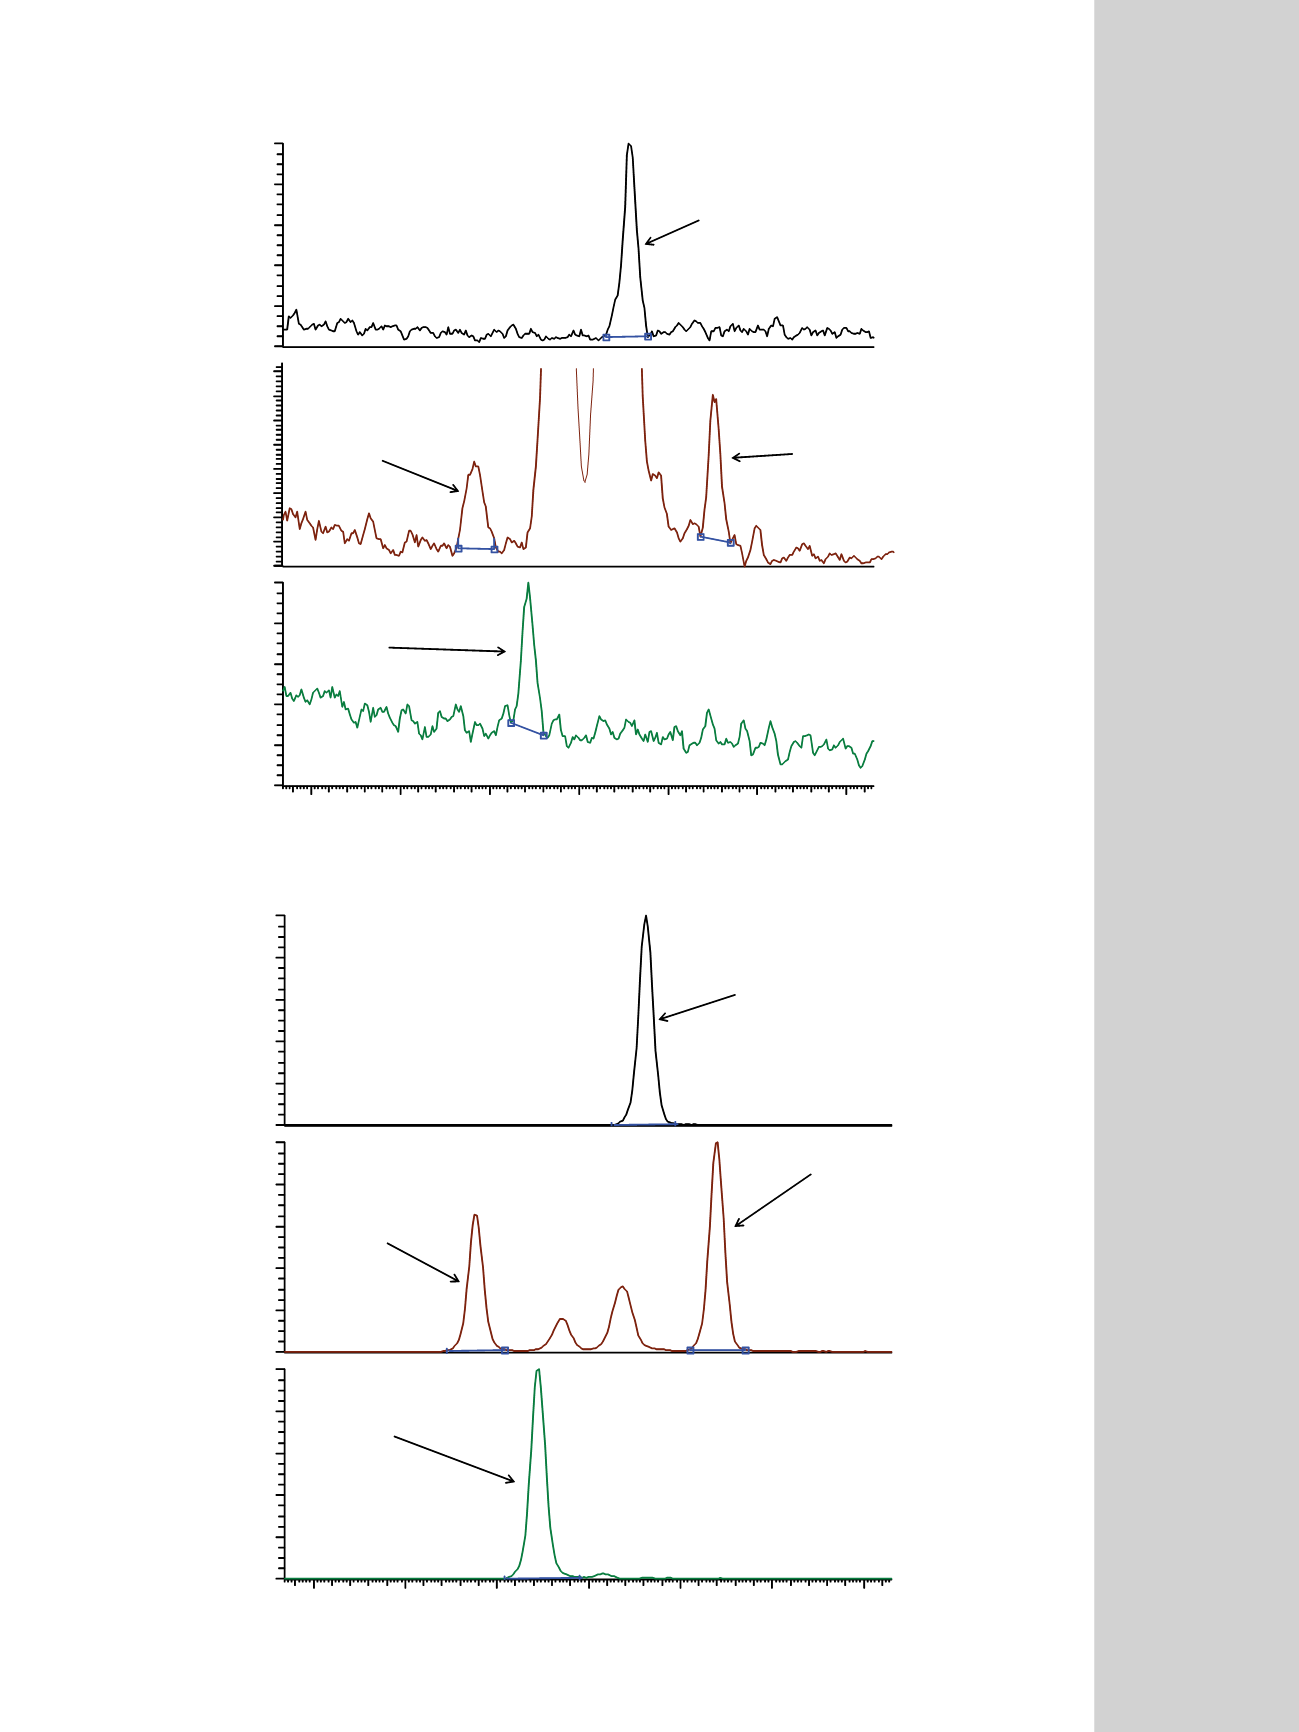
Figure 3. SRM chromatogram of a 2 ng/mL standard showing resolution of analytes from unknown
endogenous interferences.
6.5
7.0
7.5
8.0
8.5
9.0
9.5
Time (min)
0
20
40
60
80
100
RelativeAbundance
0
20
40
60
80
100
RelativeAbundance
0
20
40
60
80
100
RelativeAbundance
JWH-073-OH
JWH-018-OH
JWH-073-COOH
JWH-018-COOH
Figure 4. SRM chromatogram of a 100 ng/mL standard.


