
Area Ratio
JWH-073-OH
Y = -0.0390119+0.0359685*X R^2 = 0.9971 W: 1/X
0 100 200 300 400 500 600 700 800 900 1000 1100
0
2
4
6
8
10
12
14
16
18
20
22
24
26
28
30
32
34
36
38
JWH-073-COOH
Y = -0.0368962+0.0247063*X R^2 = 0.9958 W: 1/X
0 100 200 300 400 500 600 700 800 900 1000 1100
0
2
4
6
8
10
12
14
16
18
20
22
24
26
28
Area Ratio
ng/mL
ng/mL
JWH-018-OH
Y = -0.0267664+0.0348393*X R^2 = 0.9949 W: 1/X^2
0 100 200 300 400 500 600 700 800 900 1000 1100
0
2
4
6
8
10
12
14
16
18
20
22
24
26
28
30
32
34
36
38
40
Area Ratio
JWH-018-COOH
Y = -0.0232387+0.02741*X R^2 = 0.9974 W: 1/X
0 100 200 300 400 500 600 700 800 900 1000 1100
0
2
4
6
8
10
12
14
16
18
20
22
24
26
28
30
Area Ratio
ng/mL
ng/mL
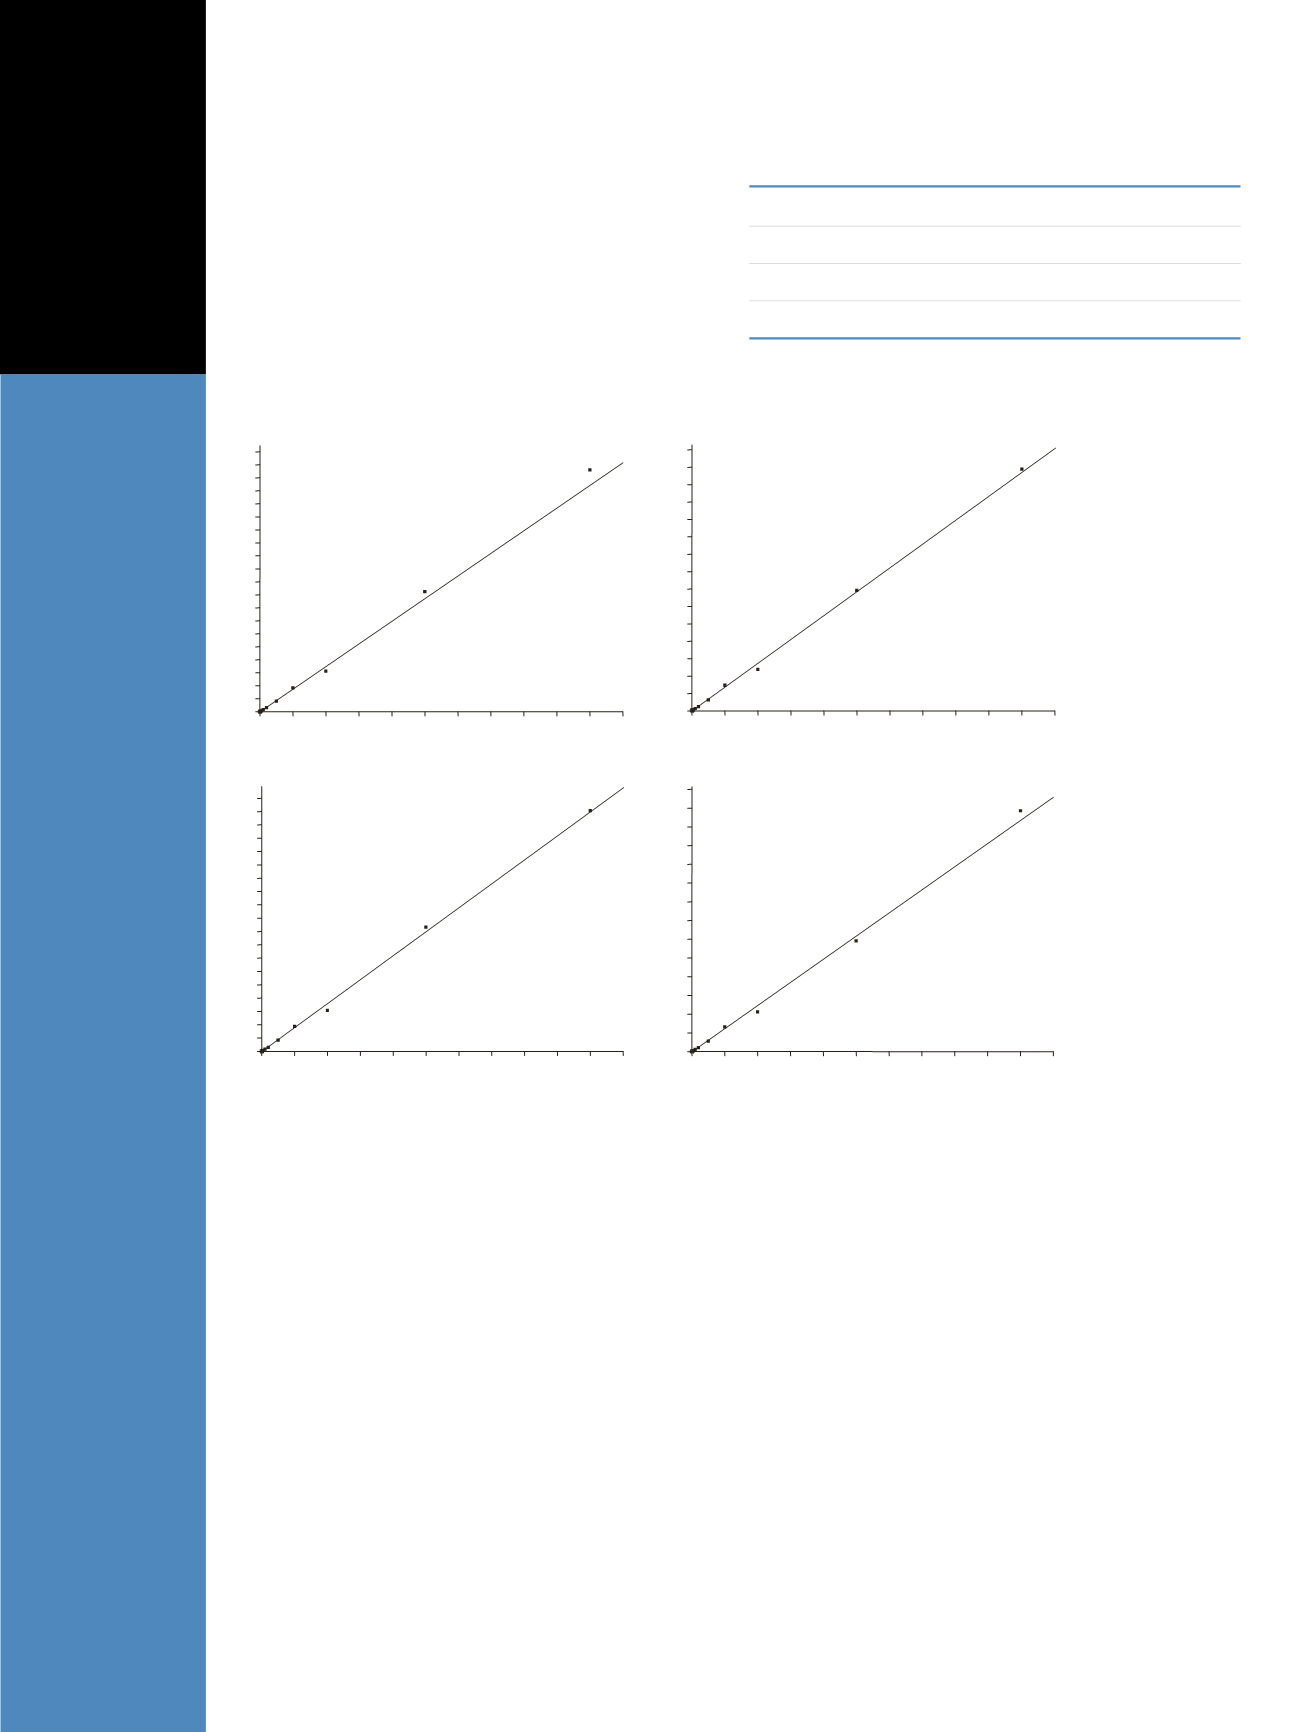
Figure 2. Representative calibration curves for JWH-018 and JWH-073 metabolites showing linearity from 2-1,000 ng/mL in urine
Results and Discussion
The method is linear from 2 to 1,000 ng/mL with R
2
val-
ues greater than 0.99 for all compounds (Figure 2). Table 1
shows QC precision and bias data for the validation runs.
A 15-minute run was required to chromatographi-
cally separate the analytes of interest from endogenous
interferences. Figures 3 and 4 show this chromatographic
resolution in a 2-ng/mL and 100-ng/mL standard, respec-
tively. Figure 5 shows a SRM chromatogram from a self-
confessed consumption sample.
LQC
MQC
HQC
JWH-018-OH
10.4/-0.790 3.50/-2.21
7.81/2.51
JWH-018-COOH
8.07/11.6
3.82/6.38
6.37/6.29
JWH-073-OH
9.02/3.72
3.42/-0.359 5.99/0.847
JWH-073-COOH
11.8/14.0
3.75/9.46
4.78/7.34
Table 1. Inter-Assay %CV and % Bias for Quality Control Samples


