


 12 / 658

2
Method Performance
Precision and accuracy were determined by analyzing
triplicate calibration curves. Method ruggedness and
matrix effects were determined by performing a mixing
test using a plasma sample analyzed at 1-fold, 2-fold, and
4-fold dilution with water.
Results and Discussion
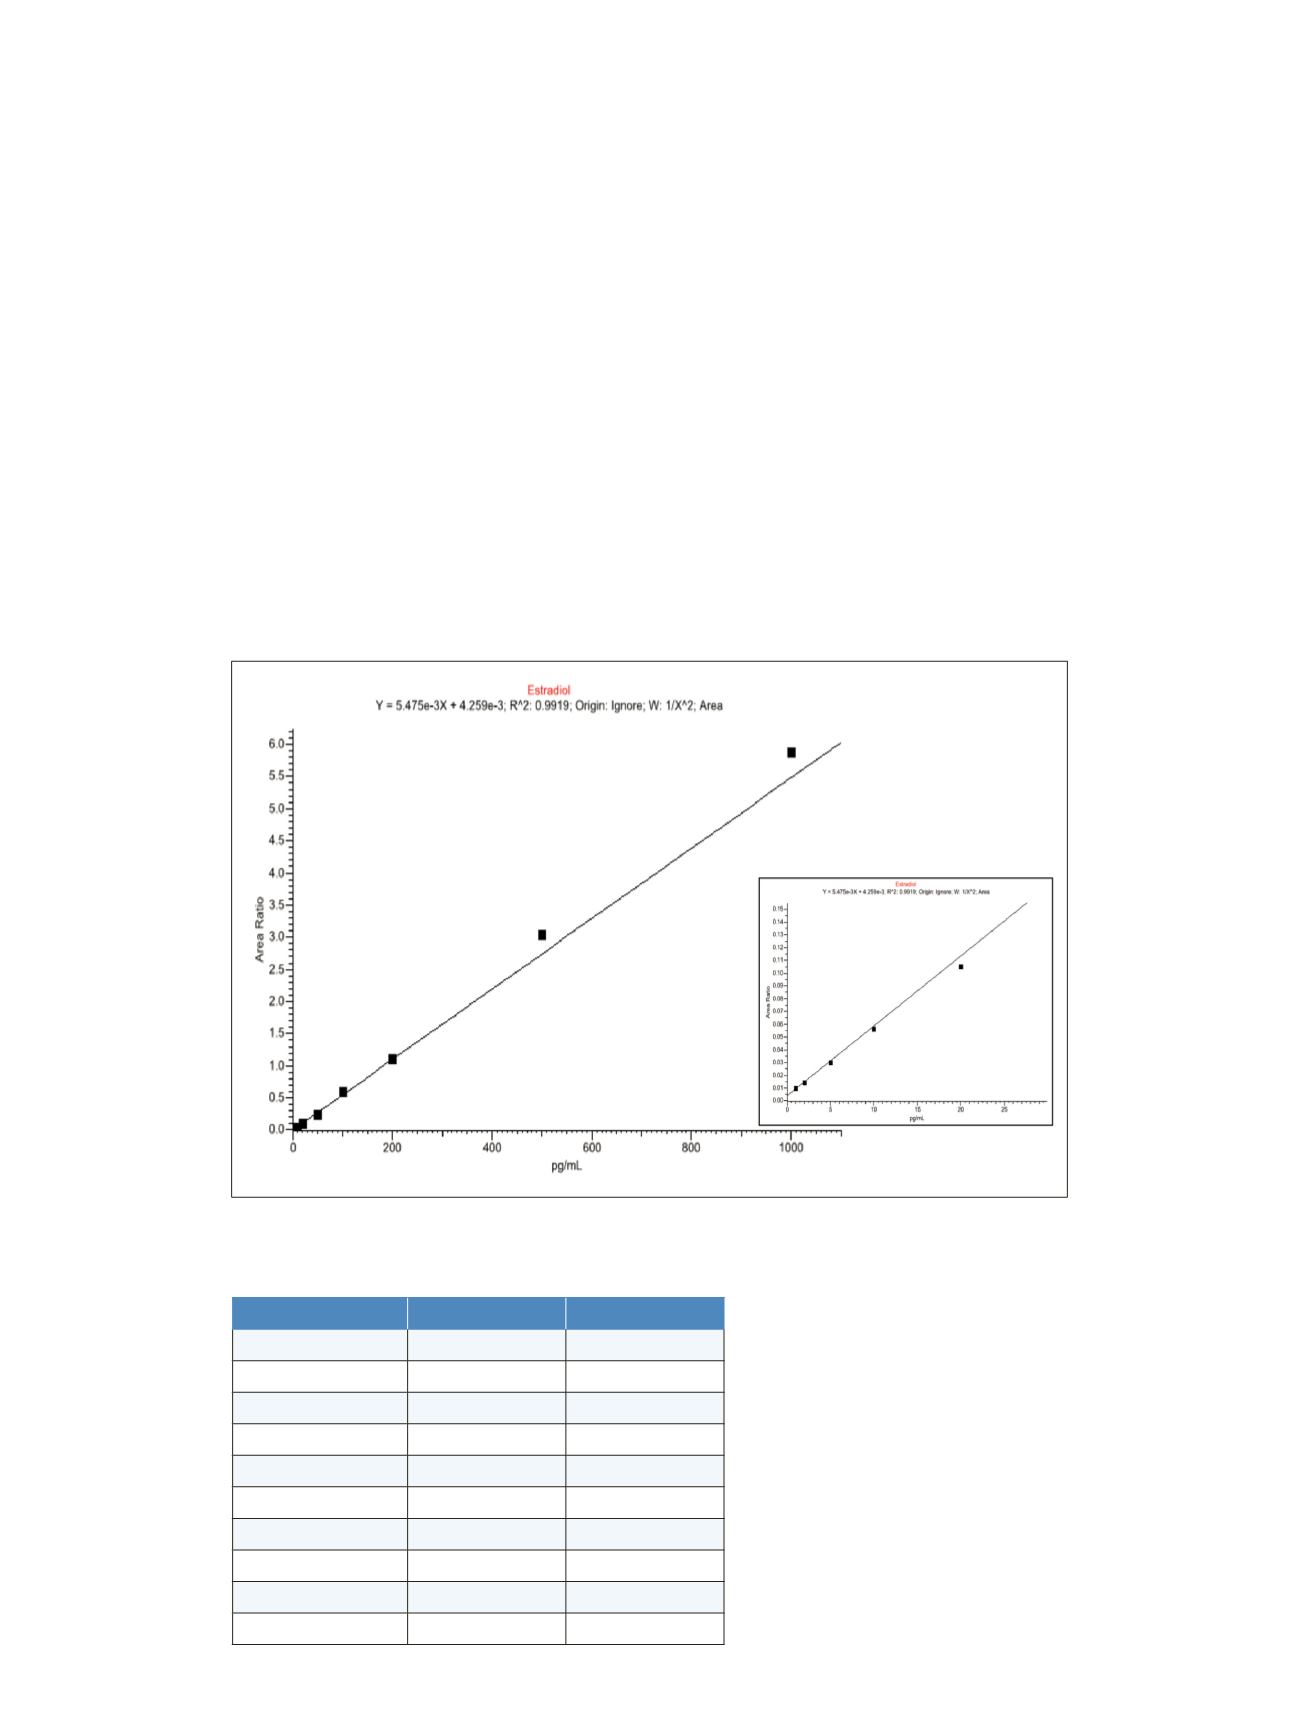
Estradiol was linear in the range of 1 to 1000 pg/mL.
Figure 1 shows a representative calibration curve for
estradiol in human plasma. Table 3 shows the excellent
precision and accuracies of the calibration curve using this
method. In addition to the precision shown, accuracies for
all calibrators across the method were within 14.3%.
Figures 2 and 3 show chromatograms of the quantifier
and confirming ions for estradiol at the lowest calibrator
level of 1 pg/mL and 5 pg/mL, respectively. The method
proved to be rugged with no matrix effects observed in
the mixing test. All diluted plasma samples showed good
recovery when compared to an undiluted sample
(Table 4). Figure 4 shows a chromatogram of a donor
plasma sample.
Figure 1. Representative calibration curves for estradiol in human CSS
Table 3. Precision and accuracies of replicate injections of calibrators
Concentration
% RSD (n = 3)
% Diff
1 pg/mL
6.86
6.70
2 pg/mL
8.09
-9.55
5 pg/mL
1.74
-5.48
10 pg/mL
2.06
-4.50
20 pg/mL
1.96
-7.62
50 pg/mL
1.51
-8.96
100 pg/mL
0.122
9.45
200 pg/mL
1.76
1.38
500 pg/mL
0.886
11.0
1000 pg/mL
0.807
7.52