


 8 / 658

2
Liquid Chromatography
Chromatographic separation was performed with a
Thermo Scientific
™
Accela
™
1250 pump and Accela Open
autosampler. The analytical column was a MassTox TDM
analytical column series A from ChromSystems. The
column was maintained at room temperature. Mobile
phases A and B were also provided by ChromSystems.
Details of the LC gradient are shown in Table 1. The
injection volume was 10 µL.
Table 1. LC gradient.
Time (min)
A (%)
B (%)
Flow rate
(µL/min)
0
40
60
600
0.5
0
100
600
1
0
100
600
1.10
40
60
600
1.8
40
60
600
Mass Spectrometry
MS/MS was performed using
a Thermo Scientific ™ TSQ Quantum Ultra ™ triple-stage quadrupole mass
spectrometerequipped with a heated electrospray
ionization (HESI-II) probe in positive mode. The MS
conditions were as follows:
Spray voltage
2500 V
Vaporizer temperature
350 ˚C
Sheath gas pressure (arbitrary units)
30
Auxilliary gas pressure (arbitrary units)
15
Capillary temperature
250 ˚C
Data were acquired in selected-reaction monitoring
(SRM) mode. SRM settings for the MPA and its internal
standard are shown in Table 2.
Table 2. SRM settings for the analyte and its corresponding
internal standard.
Analyte Precursor
Ion (
m/z
)
Quantifier
Ion (
m/z
)
Collision
Energy
(V)
Tube Lens
(V)
MPA
321.0
207.0
22
80
MPA-
d
3
324.0
210.0
22
80
Results and Discussion
Intraday Precision and Accuracy
The intraday precision and accuracy were evaluated using
20 replicates of the two quality control samples at the
following concentrations: Level 1 (1.94 mg/L) and Level 2
(5.5 mg/L). The precision was calculated as the coefficient
of variation (CV, %) within a single run and the accuracy
as the bias or percentage of deviation between nominal
and measured concentration. Results are reported in
Table 3.
Table 3. Intraday accuracy and precision results.
Quality Controls
Accuracy (%)
CV (%)
Level 1
113.2
2.7
Level 2
112.1
2.7
Interday Precision and Accuracy
The interday precision and accuracy were evaluated using
10 replicates of the two quality control samples at the
following concentrations: Level 1 (1.94 mg/L) and Level 2
(5.5 mg/L). The precision was calculated as the coefficient
of variation (CV, %) between different extractions and
runs, and the accuracy as the bias or percentage of
deviation between nominal and measured concentration.
Results are reported in Table 4.
Table 4. Interday accuracy and precision result.
Quality Controls
Accuracy (%)
CV (%)
Level 1
103.1
7.0
Level 2
103.1
4.9
Lower Limit of Quantitation (LLOQ), Upper Limit of
Quantitation (ULOQ), and Linear Range
As previously noted, the MassTox Mycophenolic Acid
kit contains 3 calibrators at 0.97, 3.89, and 9.46 mg/L.
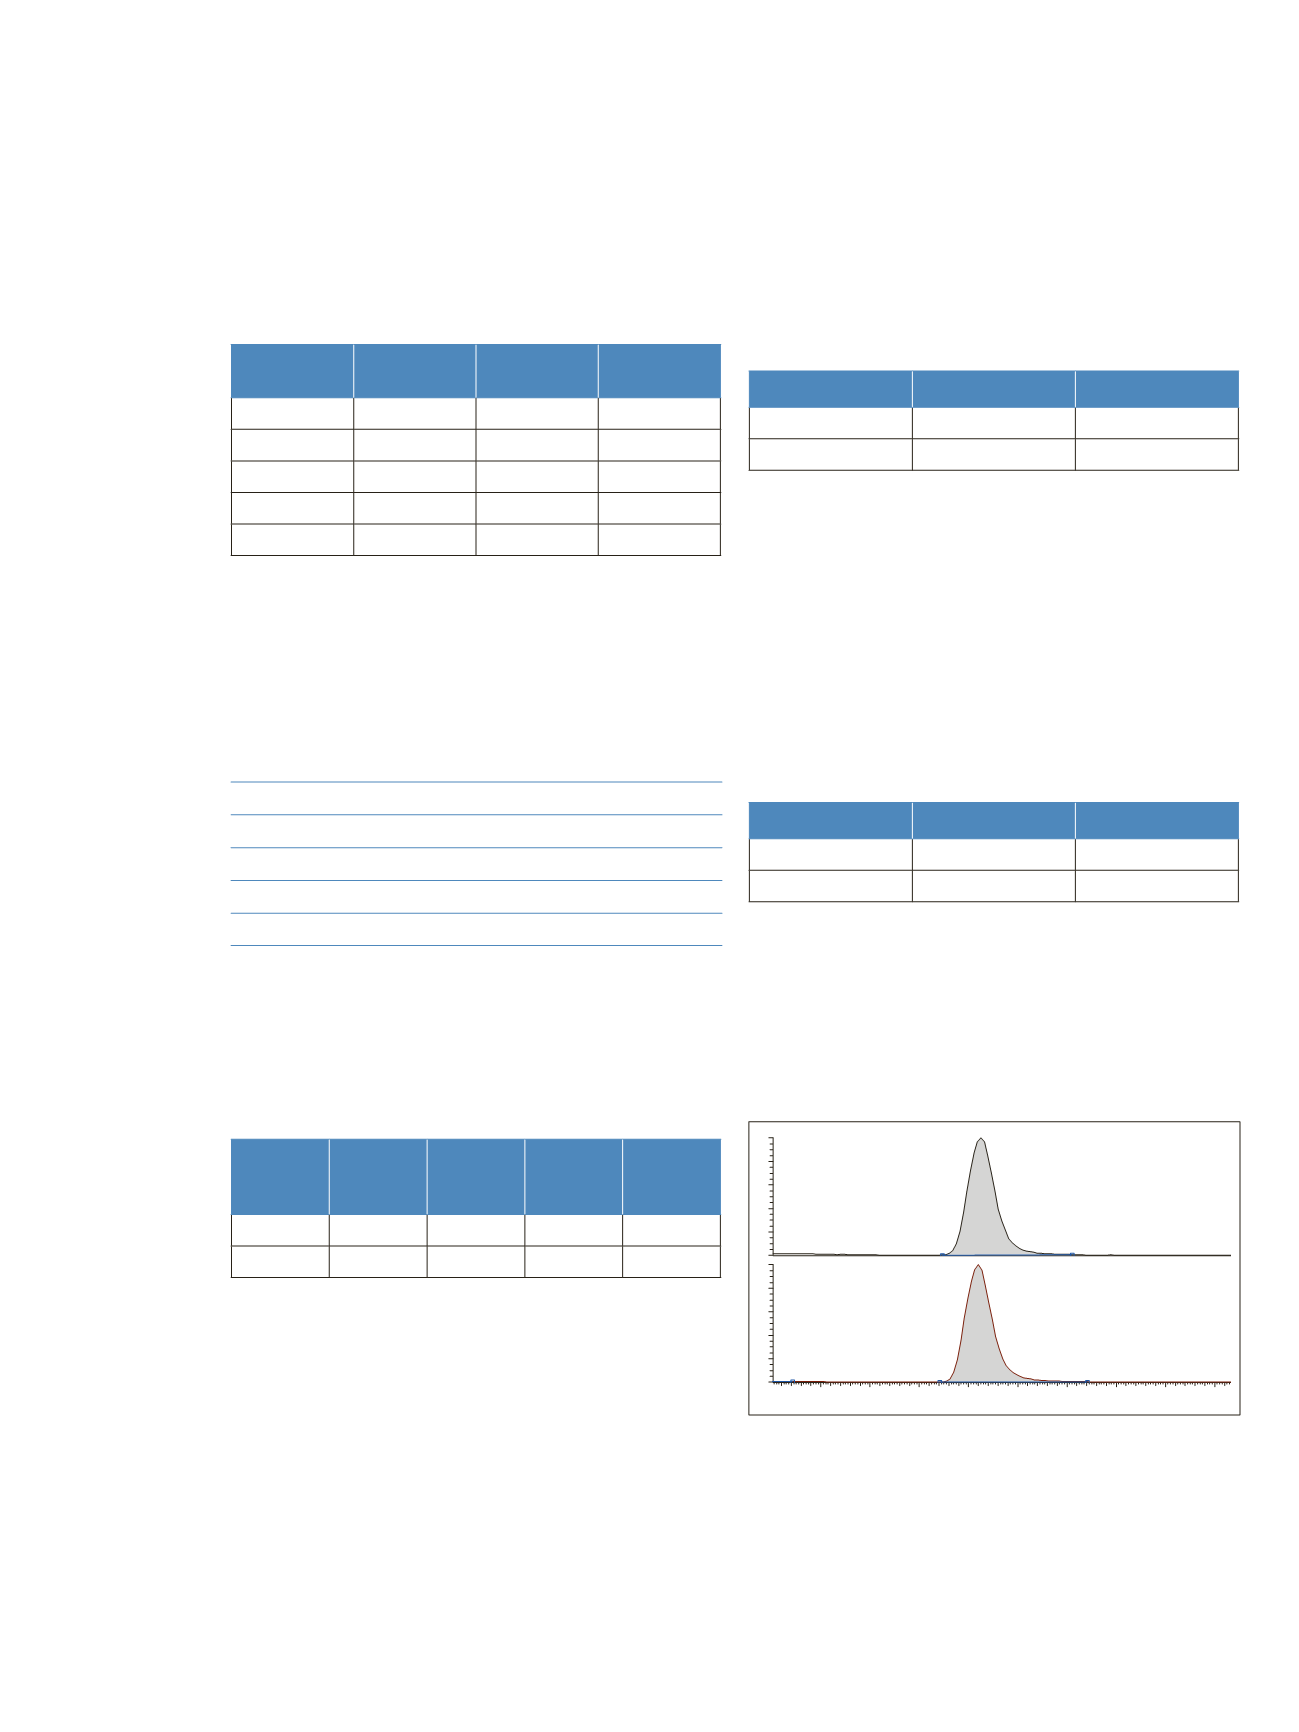
Figure 1 shows SRM chromatograms of MPA at
0.97 mg/L (Calibrator 1).
Figure 1. SRM chromatograms of MPA at 0.97 mg/L (Calibrator 1).
1.0
1.1
1.2
1.3
1.4
1.5
1.6
1.7
1.8
Time (min)
0
20
40
60
80
100
0
20
40
60
80
100
RT: 1.32
RT: 1.32
MPA
MPA-
d
3