
3
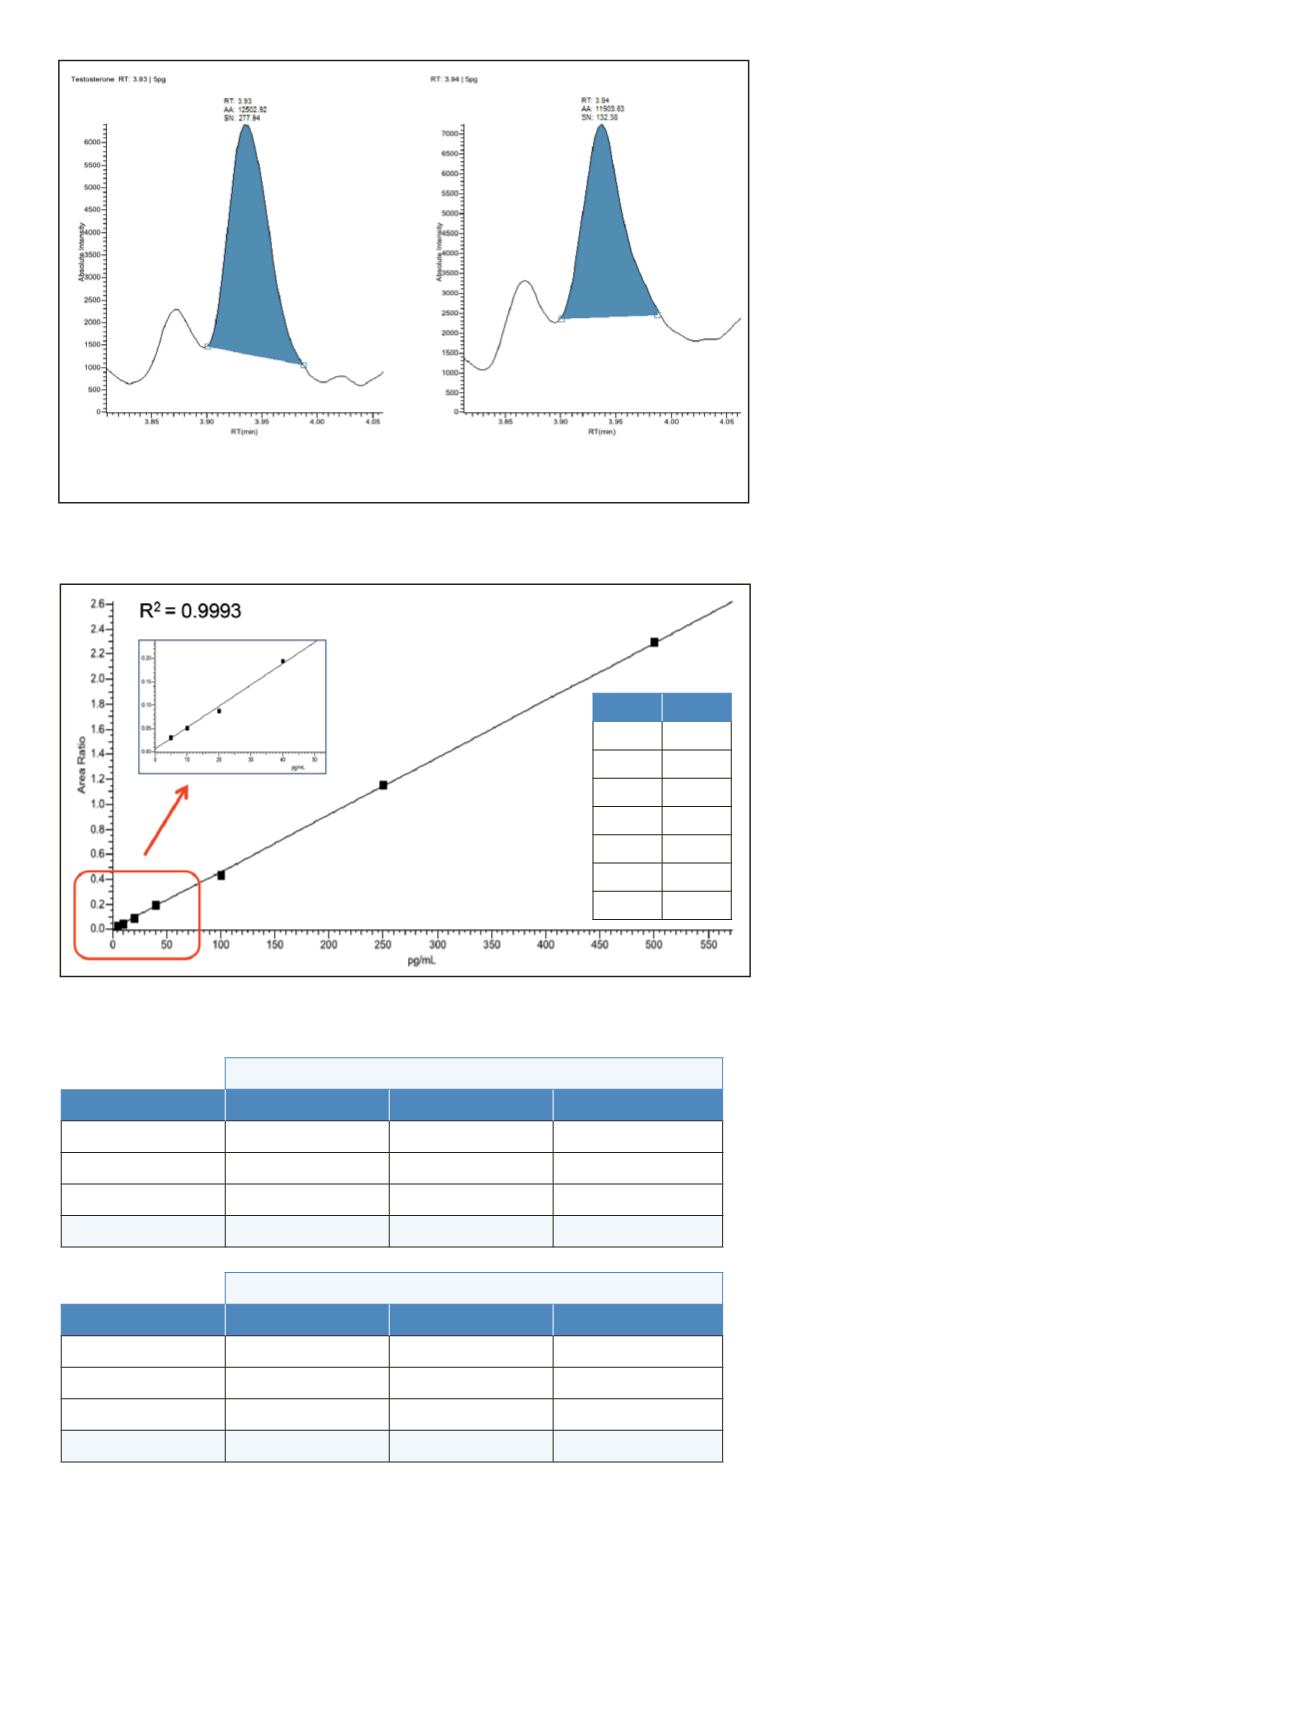
Figure 2. Chromatogram of the lowest calibration standard 5 pg/mL in CSS: (A) quantifier and
(B) qualifier peaks
Figure 3. Representative calibration curve for testosterone
Table 3. Intra-assay precision
A
B
m/z
: 97.300
m/z
: 109.300
73.62% - 110.43% 109.300/97.300 = 95.21%
Concentration (pg/mL)
QC1- 10 pg/mL
Batch #1
Batch #2
Batch #3
QC1-1
10.6
11.1
11.0
QC1-2
11.4
11.4
11.1
QC1-3
11.0
11.4
10.9
% RSD
3.4
1.5
0.58
Concentration (pg/mL)
QC2- 50 pg/mL
Batch #1
Batch #2
Batch #3
QC2-1
46.7
49.3
44.3
QC2-2
47.4
50.1
43.8
QC2-3
46.6
48.1
44.9
% RSD
0.89
2.0
1.2
Conc.
% Diff
5
9.96
10
-0.10
20
-9.57
40
3.45
100 -5.28
250 0.93
500 0.60


