25
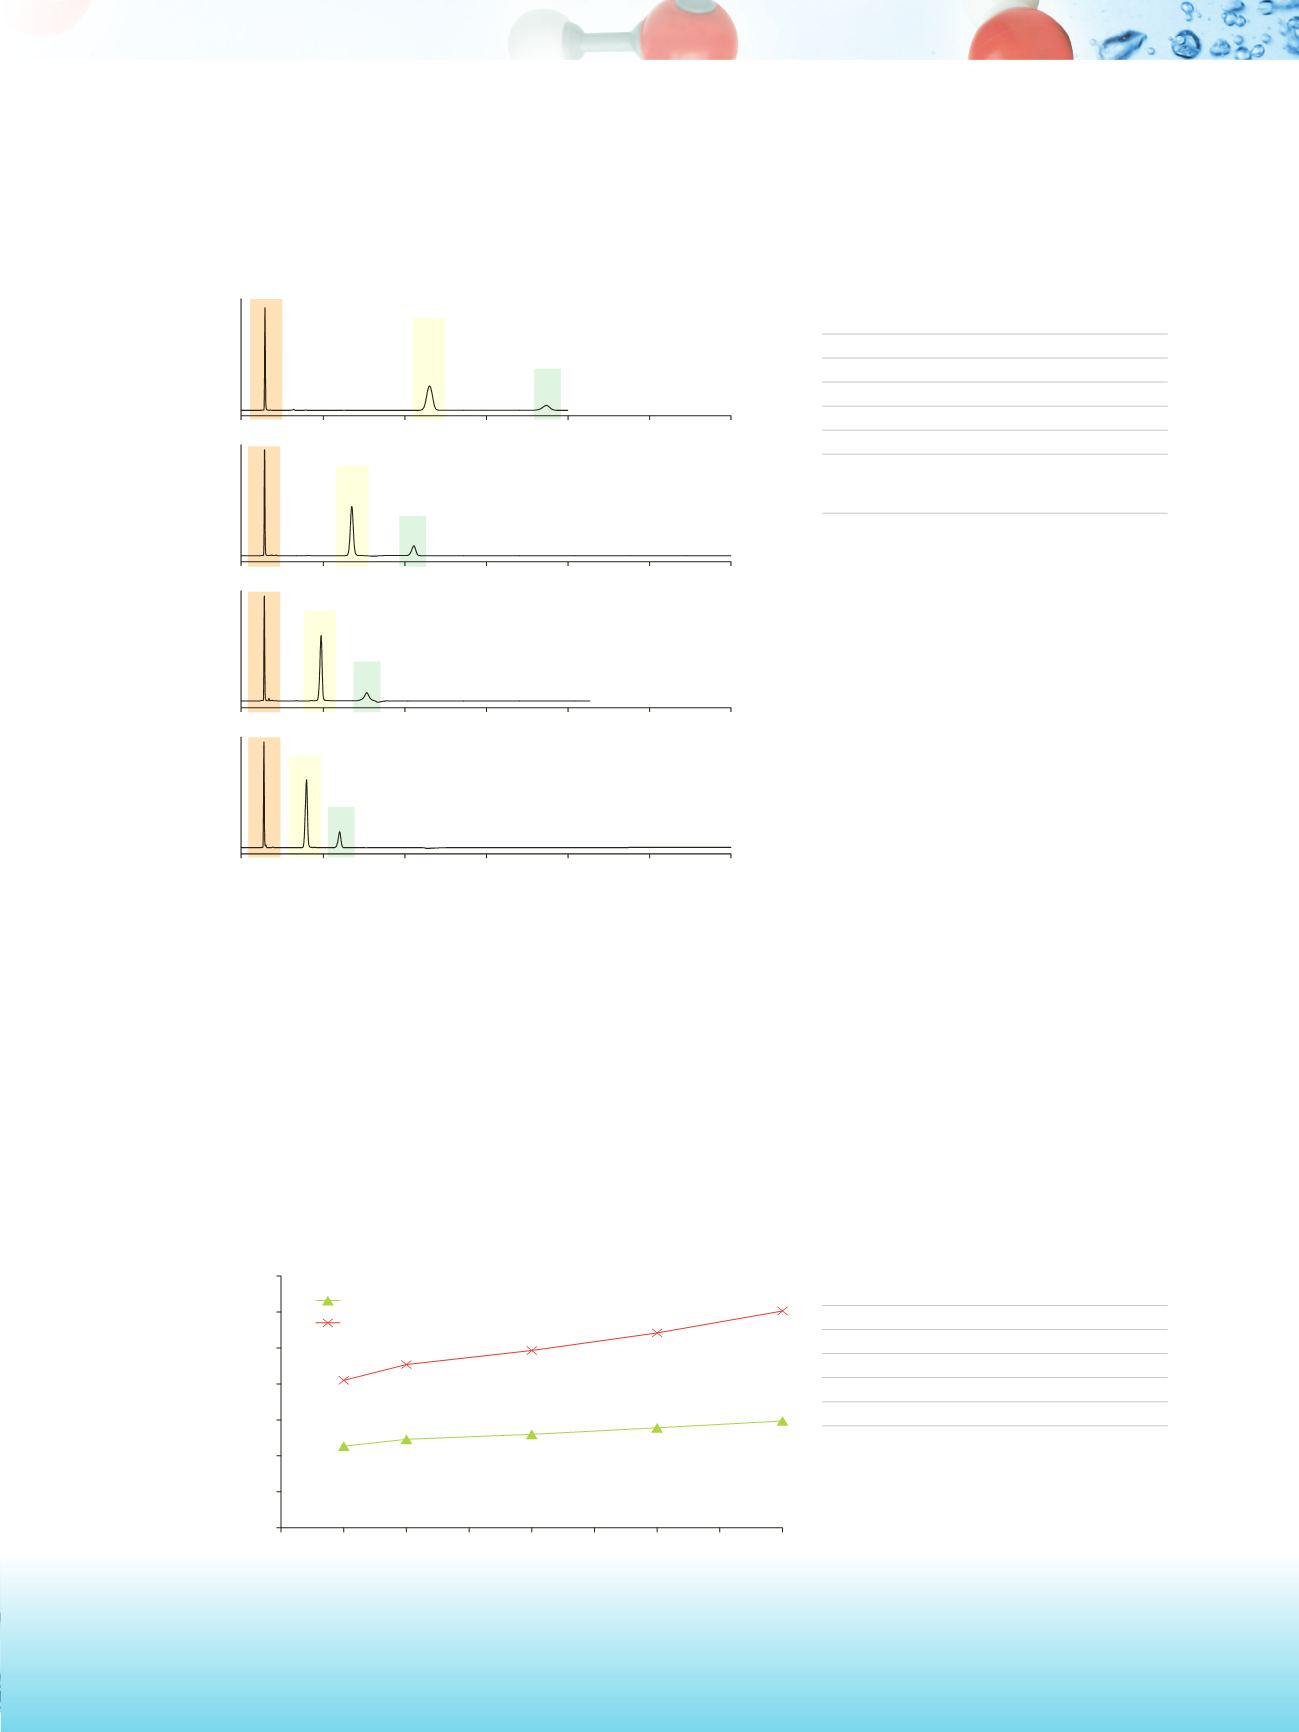
This is also illustrated by the following chromatograms, which show the separation of an acidic mixture, with
retention of the anionic analytes decreasing as the concentration of ammonium acetate increases.
Time (min)
5
10
15
20
25
30
0
5
10
15
20
25
30
0
5
10
15
20
25
30
0
5
10
15
20
25
30
0
1
2
3
1
2
3
1
2
3
1
2
3
5 mM Ammonium acetate
10 mM Ammonium acetate
15 mM Ammonium acetate
20 mM Ammonium acetate
From the chromatograms above it is also evident that the increased salt concentration is beneficial to the peak
shape, with sharper peaks when 20 mM ammonium acetate is used.
Increased salt concentrations result in increased retention of positively charged solutes on stationary phases
with same charge, as demonstrated below, where the retention of cytosine and cytidine on an anion exchanger
increases with the salt concentration. Enhanced hydrogen-bonding interactions (between the analyte and the
stationary phase) are responsible for this behavior. The hydrogen-bonding interactions are facilitated by the
increased population of solvated salt ions in the mobile phase (salting-out effect).
k
Ammonium Acetate concentration (mM)
0
1
2
3
4
5
6
7
2.5
0
5
7.5
10
12.5
15
17.5
20
k' Cytosine
k' Cytidine
Column:
Hypersil GOLD HILIC
, 5 µm
100 x 4.6 mm
Mobile Phase:
90/10 acetonitrile/ammonium acetate
Flow Rate:
1.0 mL/min
Inj.Volume:
5 µL
Temp.:
30 ˚C
Detection:
228 nm
Sample:
1. Salicylamide
2. Salicylic acid
3.Aspirin
Separation of a mixture of acids on Hypersil GOLD HILIC (anion exchanger)
The effect of ammonium acetate concentration on the retention of cytosine and cytidine on
Hypersil GOLD HILIC (anion exchanger)
Column:
Hypersil GOLD HILIC
, 5 µm
100 × 4.6 mm
Mobile Phase:
90/10 acetonitrile/ammonium acetate
Flow Rate:
1.0 mL/min
Inj.Volume:
5 µL
Temp.:
30 ˚C
Detection:
248 nm


