 
          4
        
        
          Sample Analysis (Components Identification)
        
        
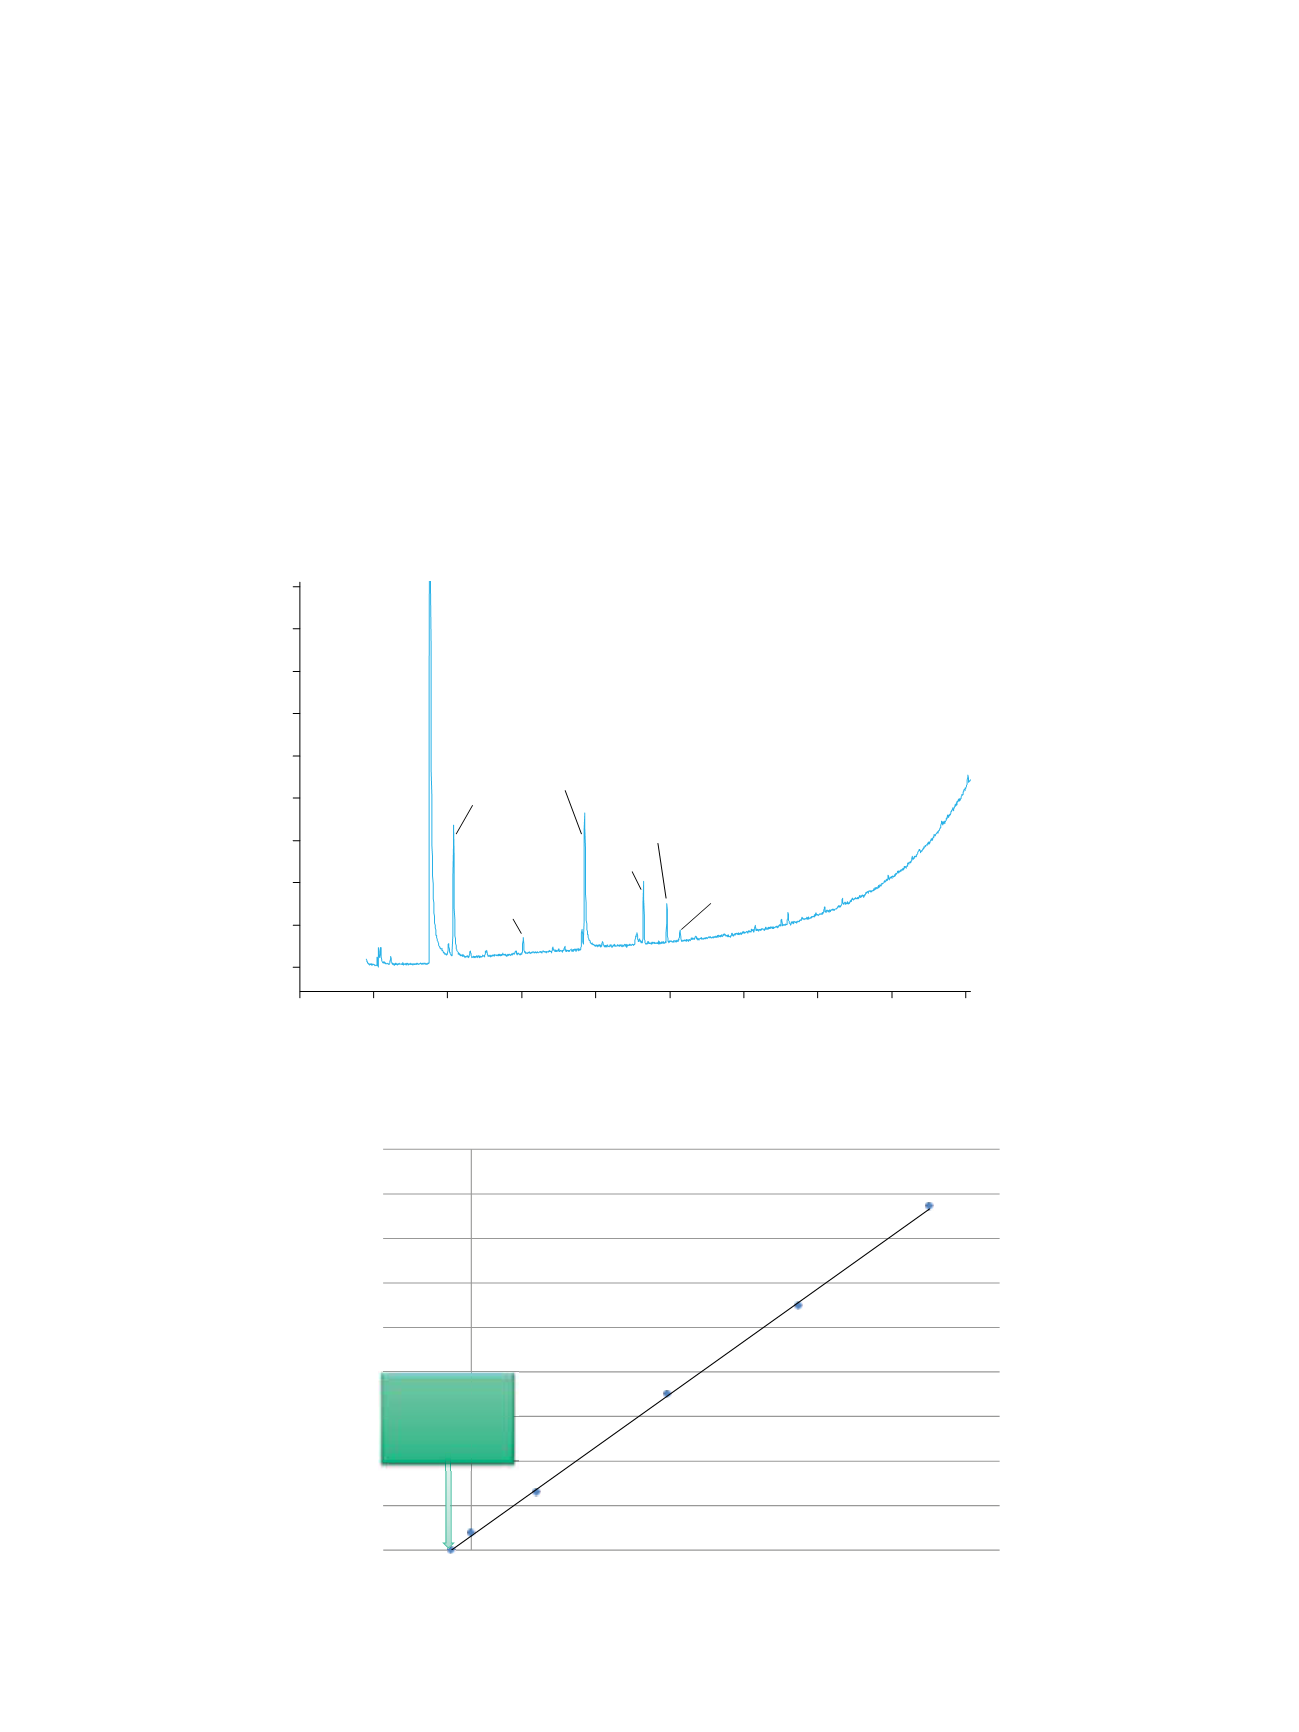
          A full-scan chromatogram of the packaging sample
        
        
          was performed in order to identify the components
        
        
          possibly present.
        
        
          Figure 4 shows the presence of numerous residual
        
        
          solvents. The larger ethanol peak comes from the
        
        
          croissant itself where ethanol is used as a preservative.
        
        
          Sample Analysis (Components Quantification)
        
        
          Quantification performed by means of the standard
        
        
          addition method was carried out for the peaks identified
        
        
          in the chromatogram in Figure 4. Figure 5 shows the
        
        
          standard addition calibration curve for


            n


          -butyl acetate
        
        
          together with the results of quantification in the sample.
        
        
          Figure 4. Full-scan sample analysis by headspace.
        
        
          Table 2 presents the results of the quantification.
        
        
          In Figure 6, the graphical representation of the
        
        
          quantification analysis shows that the two main
        
        
          residual solvents identified in the sample are 1-methoxy
        
        
          2-propanol and 2-propanol. Their amounts do not exceed
        
        
          the level of 0.1 mg/m
        
        
          2
        
        
          each, while the other detected
        
        
          residual solvents have been quantified in the level of 0.01
        
        
          mg/m
        
        
          2
        
        
          or lower.
        
        
          Conclusion
        
        
          A completely automated method for analyzing and
        
        
          quantifying VOCs in food packaging materials is
        
        
          presented. The combination of sample preparation steps
        
        
          and an analytical step in the same sequence allows high
        
        
          accuracy in quantification, high sample throughput, and
        
        
          minimizes error-prone manual manipulations. For the
        
        
          majority of residual solvents analyzed in this method, their
        
        
          individual limit of quantitation was below 0.01 mg/m
        
        
          2
        
        
          .
        
        
          RT:
        
        
          0.00 - 45.28
        
        
          0
        
        
          5
        
        
          10
        
        
          15
        
        
          20
        
        
          25
        
        
          30
        
        
          35
        
        
          40
        
        
          45
        
        
          Minutes
        
        
          5
        
        
          10
        
        
          15
        
        
          20
        
        
          25
        
        
          30
        
        
          35
        
        
          40
        
        
          45
        
        
          50
        
        
          Methyl cellosolve
        
        
          Ethyl acetate
        
        
          2-propanol
        
        
          Ethanol
        
        
          1-butanol
        
        
          1-methoxy 2-propanol
        
        
          Toluene
        
        
          Butyric acid ethyl ester
        
        
          0
        
        
          500000
        
        
          1000000
        
        
          1500000
        
        
          2000000
        
        
          2500000
        
        
          3000000
        
        
          3500000
        
        
          4000000
        
        
          4500000
        
        
          -0.01
        
        
          0
        
        
          0.01
        
        
          0.02
        
        
          0.03
        
        
          0.04
        
        
          0.05
        
        
          0.06
        
        
          Peak Area
        
        
          Concentration mg/m
        
        
          2


            0.0022 mg/m


            2


            n-butyl acetate


          R
        
        
          2
        
        
          = 0.9996
        
        
          Figure 5. Quantitation via standard addition calibration for n-butyl acetate.