4
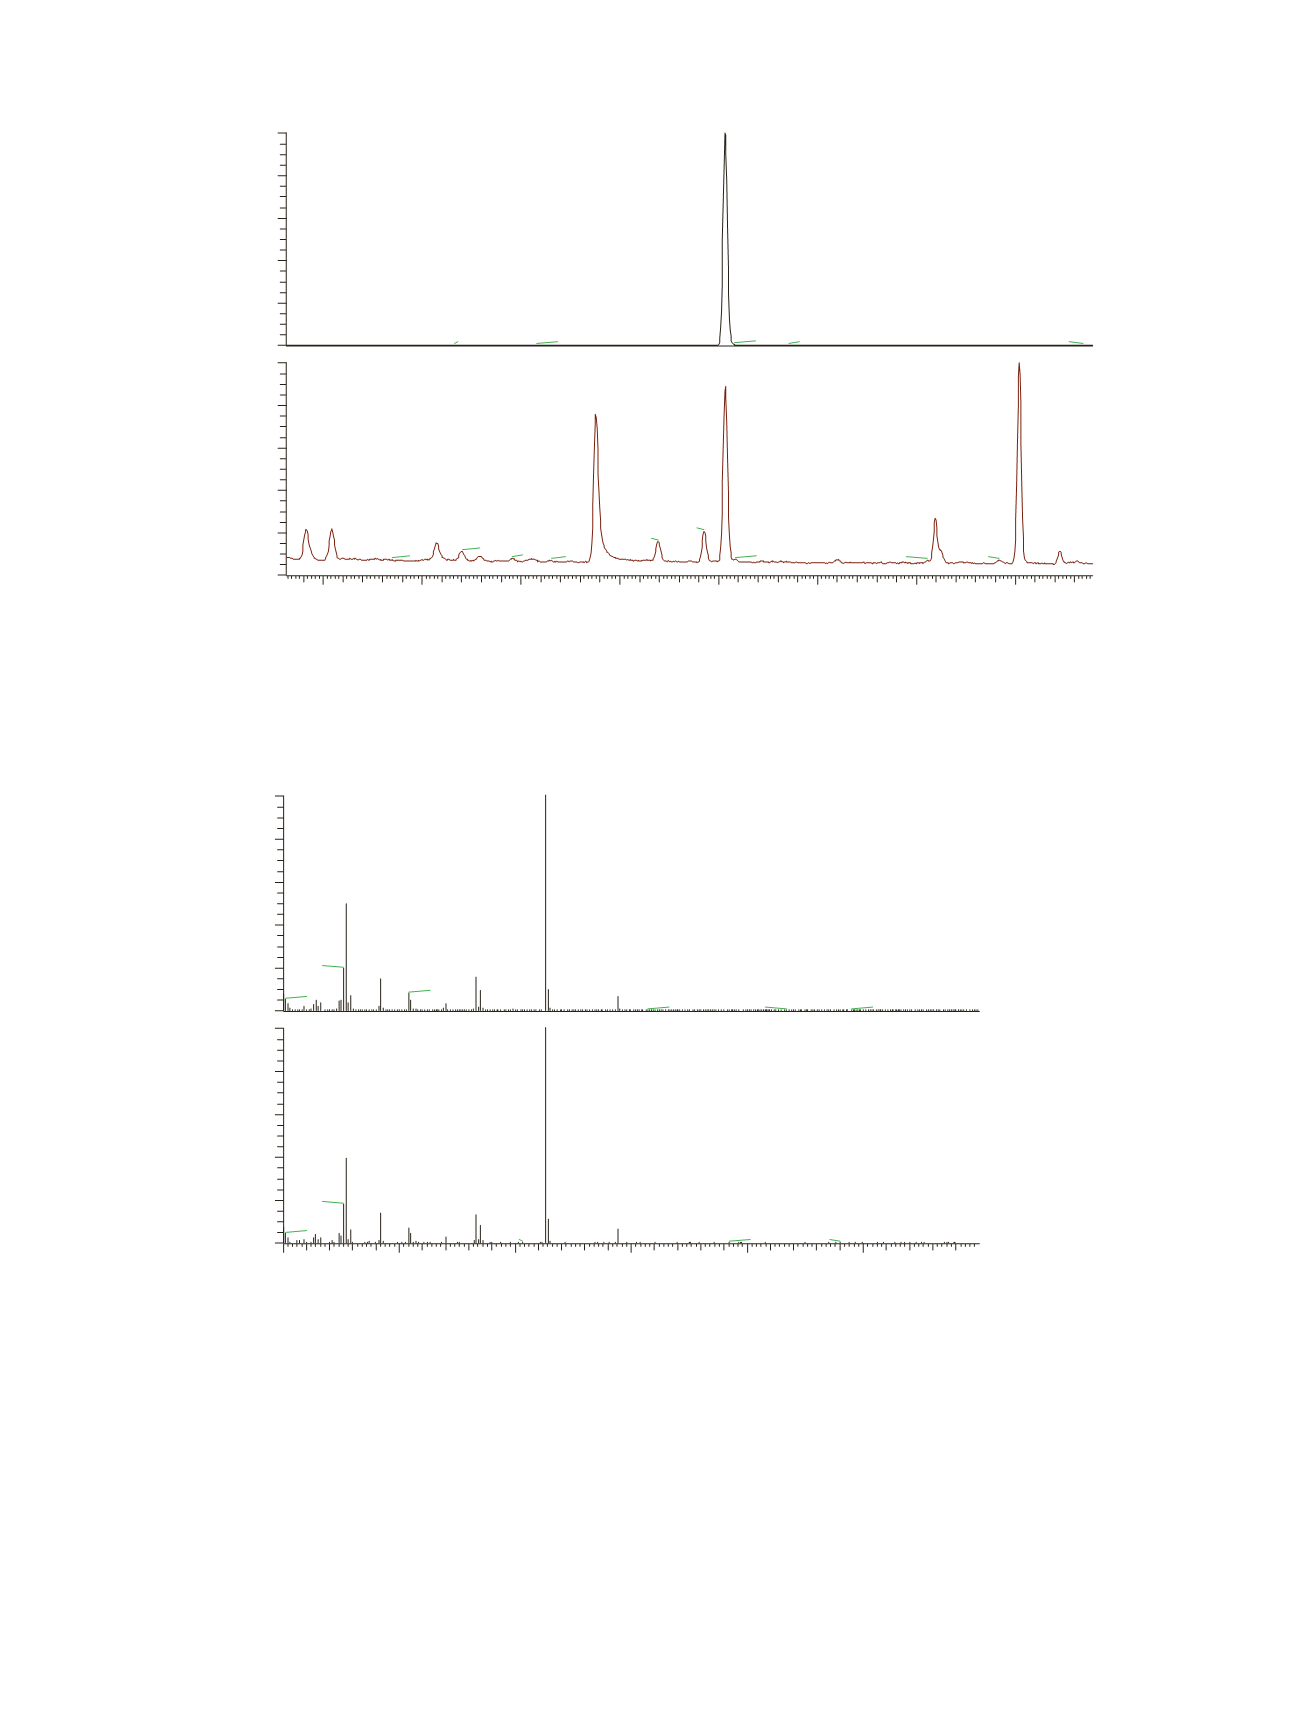
Figure 2. Dimethyl-phthalate chromatograms from spiked sample with the selective mass chromatogram (top) and the Full
Scan trace (bottom) allowing the interference free peak area integration of the PAE compound.
Figure 3. Dimethyl-phthalate spectra from standard (top) and sample (bottom).
RT:
9.31 - 13.39
9.5
10.0
10.5
11.0
11.5
12.0
12.5
13.0
Time (min)
0
20
40
60
80
100
0
20
40
60
80
100
Relative Abundance
11.53
11.58
10.46
10.92
9.80
12.59
12.31
11.85
13.34
12.94
91.11
65.9
9.99 10.16
10.58
13.02
11.53
10.88
12.59
9.54
11.43
11.19
10.07
13.23
10.20
9.76
10.46
11.58
12.10
9.85
10.66
12.92
12.55
NL:
1.01E7
m/z=
162.50-
163.50
MS
20121121-
spiked1-03
NL:
3.45E7
TIC MS
20121121-
spiked1-03
50
100
150
200
250
300
m/z
0
20
40
60
80
100
0
20
40
60
80
100
Relative Abundance
163.09
77.06
76.06
133.07
92.06
104.06
194.10
51.06
149.06
207.11
281.04
266.91
294.89 327.23
163.07
77.05
76.03 92.05
133.06
194.10
51.04
120.02 153.21
229.18
308.78 339.13
242.31 290.11
NL: 1.49E8
20121121-pae-
4ppm#1044 RT: 11.55
AV: 1 T: {0,0} + c EI Full
ms [50.00-350.00]
NL: 2.81E6
20121122-samp5#1036
RT: 11.52 AV: 1 SB: 2
21.28 , 21.45 T: {0,0} + c
EI Full ms [50.00-350.00]


