5
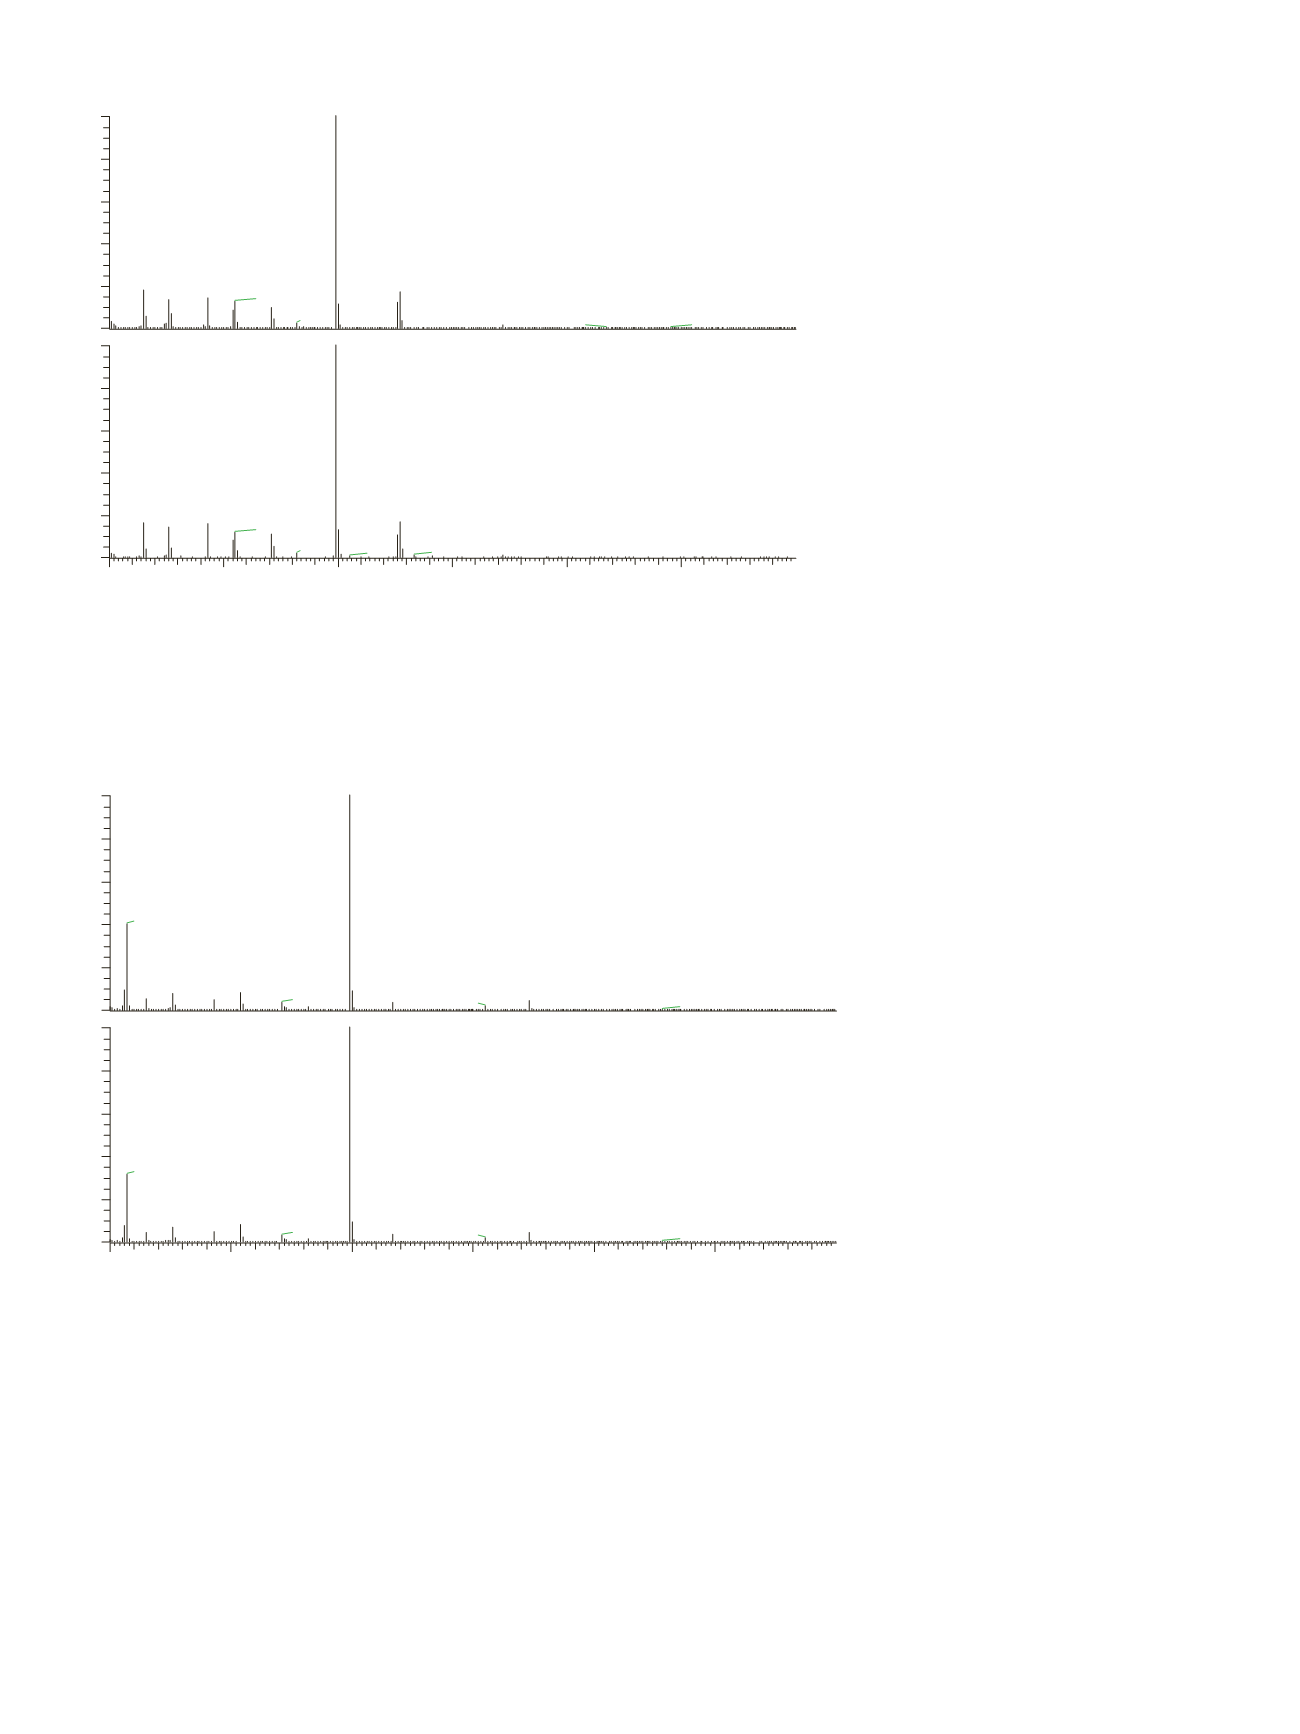
Figure 4. Diethyl-phthalate spectra from standard (top) and sample (bottom).
Figure 5. Di-isobutyl-phthalate spectra from standard (top) and sample (bottom).
50
100
150
200
250
300
m/z
0
20
40
60
80
100
0
20
40
60
80
100
Relative Abundance
149.05
65.06
177.12
93.07 105.07
132.07
222.16
22.182
01.591 51.461
267.14
326.98
295.30
149.03
177.09
65.07 93.04 105.08
132.11
222.13
183.14
155.07
341.08
285.42 313.30
252.43
NL: 1.80E8
20121121-pae-
4ppm#1480 RT: 13.03
AV: 1 T: {0,0} + c EI Full
ms [50.00-350.00]
NL: 1.74E6
20121122-samp5#1473
RT: 13.01 AV: 1 SB: 2
21.28 , 21.45 T: {0,0} + c
EI Full ms [50.00-350.00]
50
100
150
200
250
300
m/z
0
20
40
60
80
100
0
20
40
60
80
100
Relative Abundance
149.07
57.11
104.06
76.05
223.15
121.04
167.08
205.14
263.23 278.27 315.06 346.28
149.05
57.09
104.03
76.05
223.12
167.05
121.02
205.11
263.14 278.16
340.95
313.41
NL: 2.67E8
20121121-pae-
4ppm#2251 RT:
15.65 AV: 1 T: {0,0}
+ c EI Full ms
[50.00-350.00]
NL: 2.38E8
20121122-
samp2#2244 RT:
15.63 AV: 1 T: {0,0}
+ c EI Full ms
[50.00-350.00]


